Results tab – EXFO FTB -5240S/5240BP Optical Spectrum Analyzer for FTB 500 (NS-1434) User Manual
Page 350
Managing Results
342
FTB-5240S/5240BP
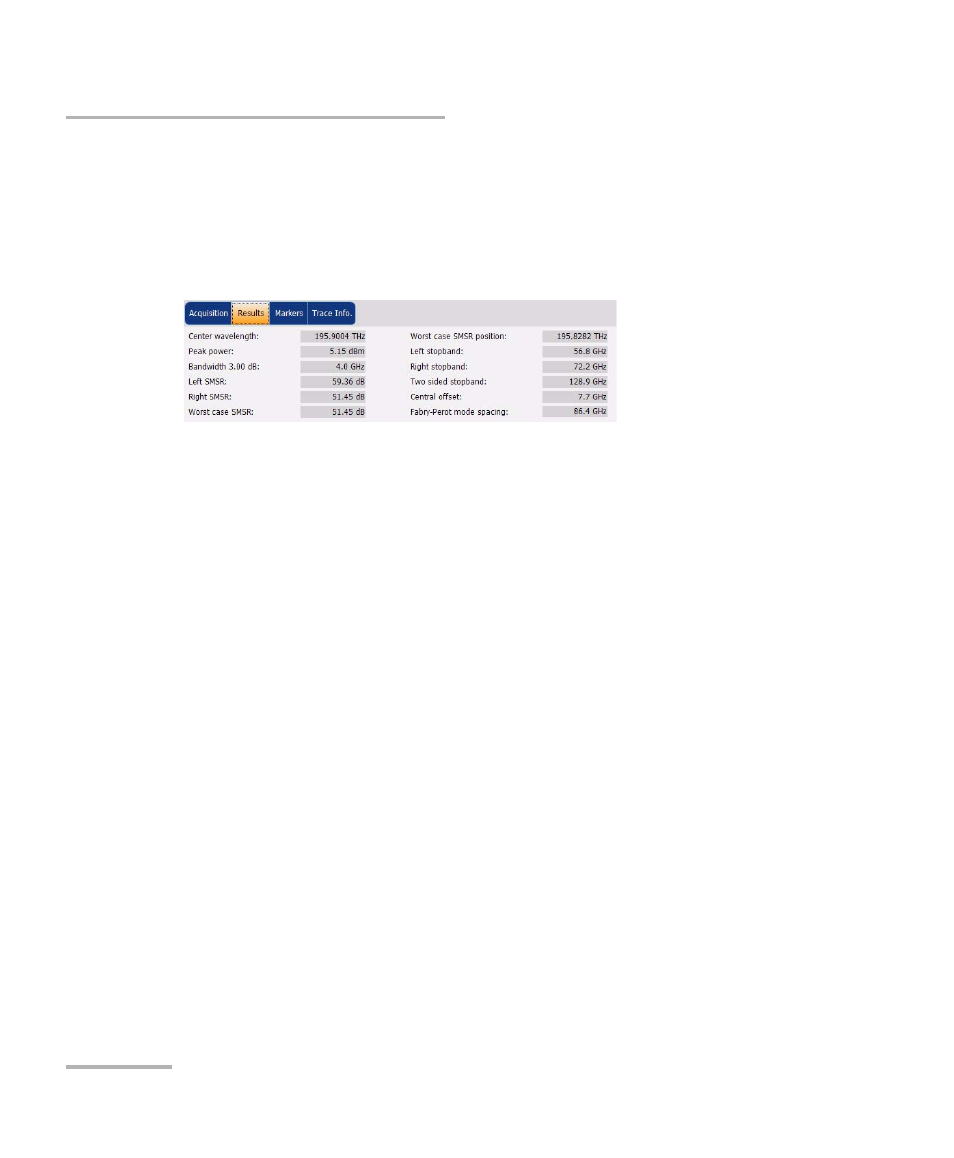
Managing DFB Test Results
Results Tab
You can view the analysis of the DFB laser source from the Results tab.
To view results:
From the main window, select the Results tab.
The following information related to the DFB measurement is displayed in
the Results table:
³
Center wavelength/frequency: indicates the spectral center-of-mass
for the peak.
³
Peak power (dBm): indicates the peak signal power.
³
Bandwidth 3.00 dB: indicates the bandwidth measured by taking the
width of a signal at 50 % linear power of the peak or -3 dB from the
peak.
³
Left SMSR: indicates the Left side-mode suppression ratio. It is the
power difference between the main mode and the most powerful
outstanding side-mode on the left.
³
Right SMSR: indicates the Right side-mode suppression ratio. It is the
power difference between the main mode and the most powerful
outstanding side-mode on the right.
³
Worst case SMSR: indicates the power difference between the main
mode and the side-mode with the highest power.
³
Worst case SMSR position: indicates the spectral position of the worst
SMSR.
³
Left stopband: indicates the spectral position difference between the
main mode and the closest side-mode on the left.