EXFO FTB -5240S/5240BP Optical Spectrum Analyzer for FTB 500 (NS-1434) User Manual
Page 377
Managing Results
Optical Spectrum Analyzer
369
Managing EDFA Test Results
When the acquisition is taken (see Starting a Measurement on page 273 for
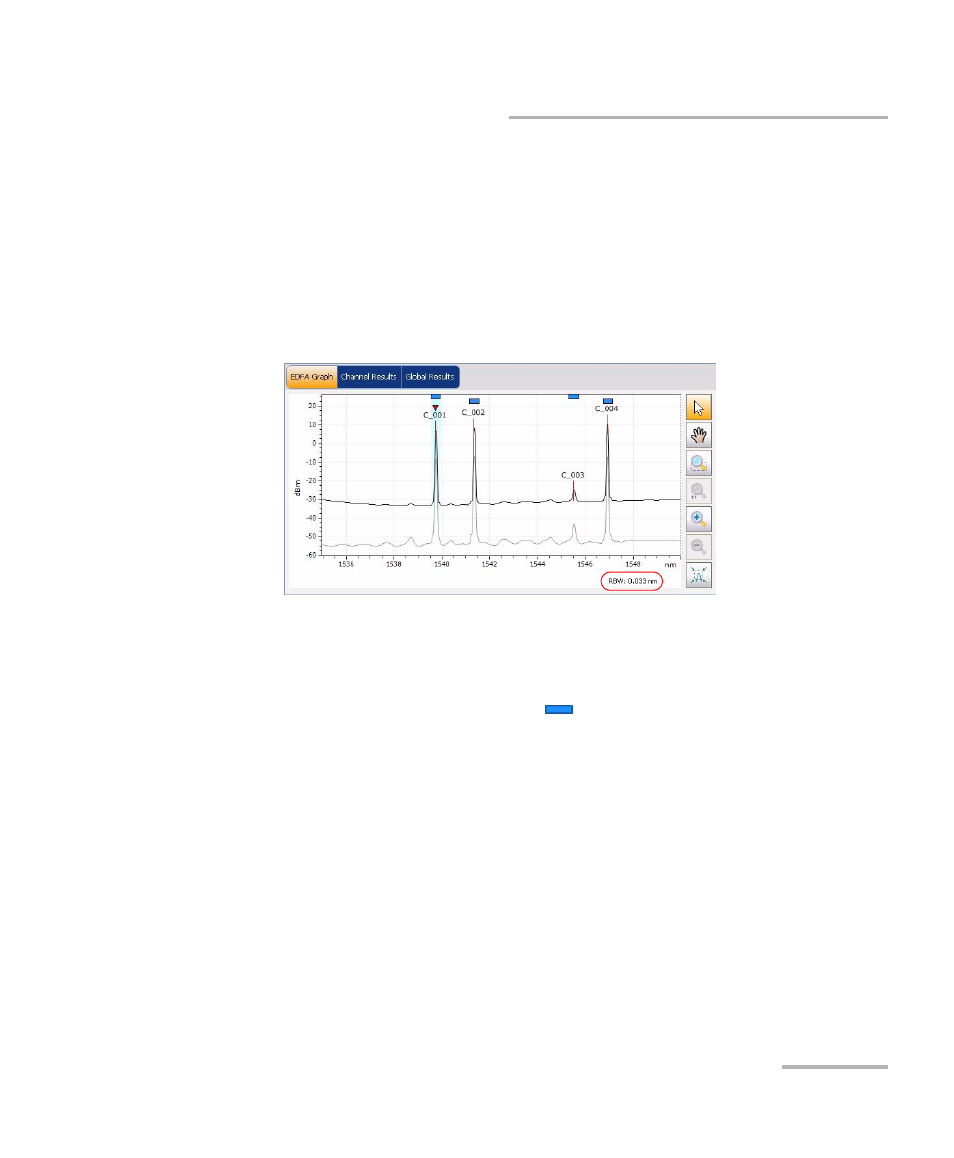
details on how to perform a test), the trace will be displayed in the EDFA
Graph tab with information along the following axis values:
³
X axis: wavelength in nm or frequency in THz
³
Y axis: optical power expressed in dBm, as measured in the optical
resolution bandwidth (RBW) of the OSA. This reference RBW is shown
at the bottom right of the graph.
If the current trace was previously saved, the graph will display the file
name of the current trace in the title bar.
The graph will display peak indicators for all the channels found by the
application. A blue horizontal bar (
) will be displayed on the top of the
channels, with a red horizontal line over the peaks to indicate the peak
position.
You can also perform the following on your graph:
³
Move markers on the graph.
³
Use zoom functions to zoom on specific areas or peaks of the graph.
Note: For more information on these, see Markers Tab on page 372 and Using