Results tab – EXFO FTB -5240S/5240BP Optical Spectrum Analyzer for FTB 500 (NS-1434) User Manual
Page 378
Managing Results
370
FTB-5240S/5240BP
Managing EDFA Test Results
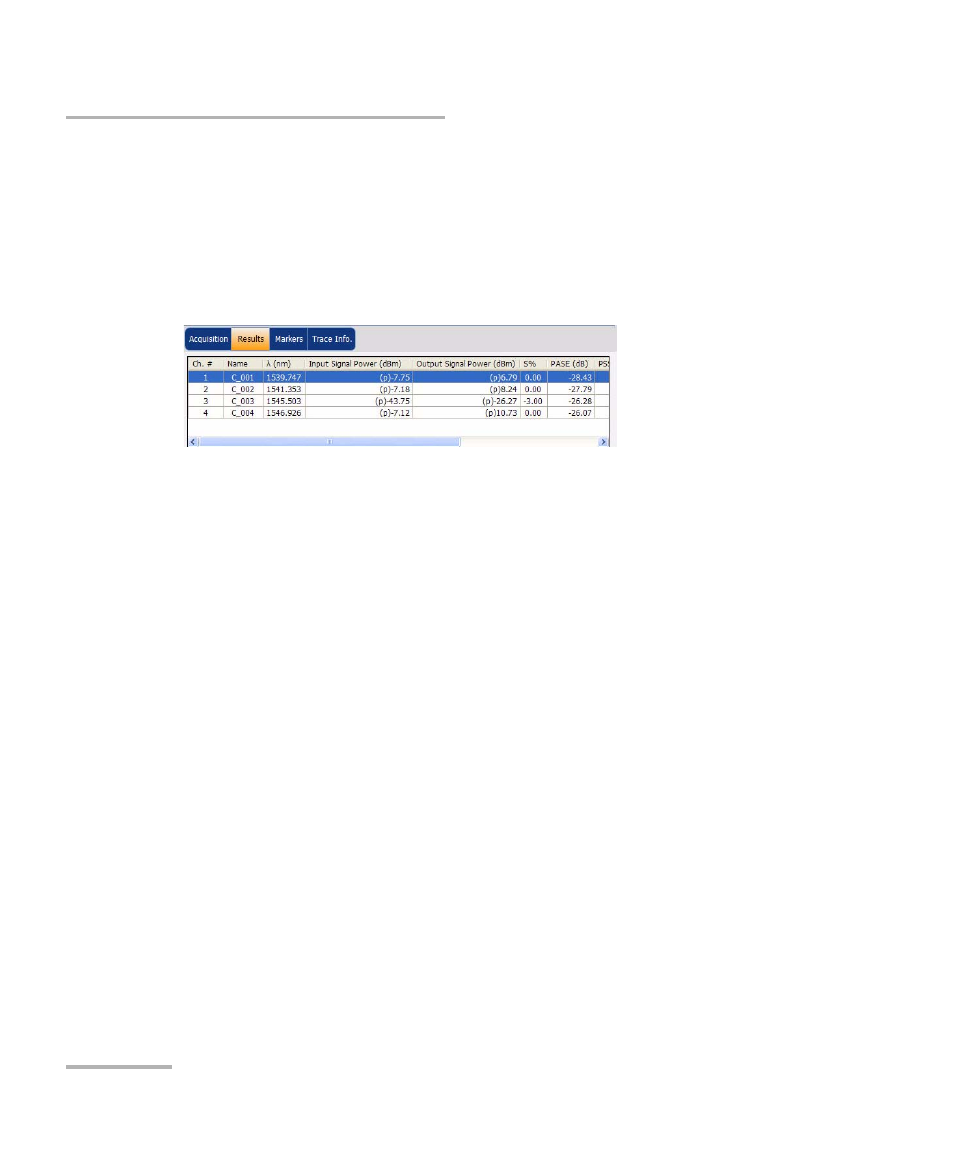
Results Tab
The results table shows channel results for the active trace. The results for
only the channels within the scan range will be displayed.
To view results:
From the main window, select the Results tab.
The following information related to the channels is displayed in the
Results table:
³
Ch#: indicates the channel number. Channel 1 corresponds to the first
channel found.
³
Name: indicates the channel name as defined in the channel list.
³
Center wavelength/frequency: indicates the spectral center-of-mass
for the peak in that channel.
³
Input Signal Power (dBm): indicates the input signal power for the
selected channel (excludes noise).
³
Output Signal Power (dBm): indicates the output signal power for the
selected channel (excludes noise).
³
S %: indicates the current output power according to the measured
output power (Output Signal Power / [Output Signal Power + PASE]).
³
PASE: indicates the power of the spontaneous emission amplified by
EDFA.
³
PSSE: indicates the power of the spontaneous emission of the source.
³
Gain: indicates the gain (Output Signal Power - Input Signal Power) for
the selected channel.