Channel graph tab – EXFO FTB -5240S/5240BP Optical Spectrum Analyzer for FTB 500 (NS-1434) User Manual
Page 332
Managing Results
324
FTB-5240S/5240BP
Managing Drift Test Results
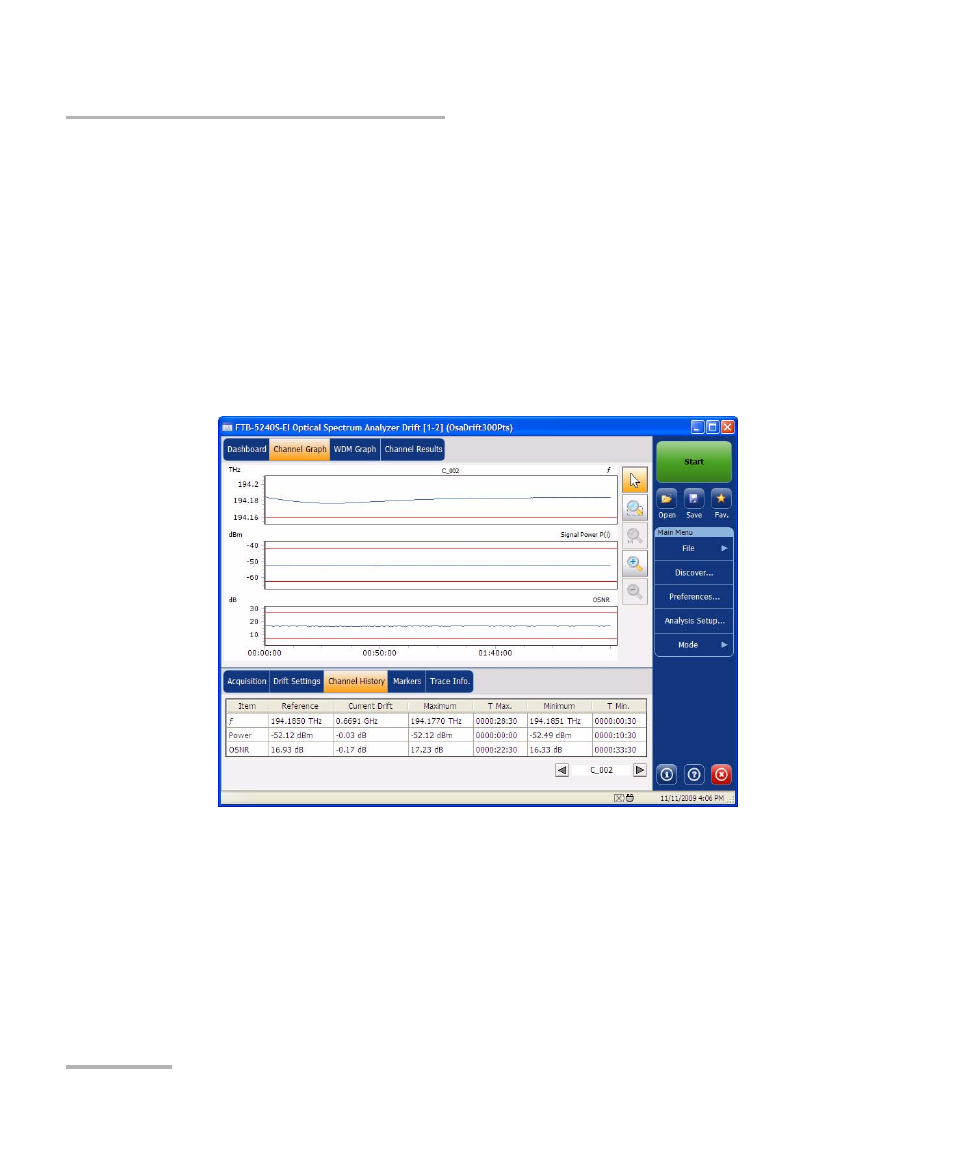
Channel Graph Tab
The Channel Graph tab displays three different graphs for the selected
channel. You can select which graphs you want to display from the Drift
Results tab in the Preferences Window. The three graphs are X-Y plots of:
³
Spectral position (center of mass of wavelength or frequency) of the
channel against time
³
Signal power of the channel against time
³
OSNR of the channel against time
You can also perform the following on your graph:
³
Use zoom functions to zoom on specific areas or peaks of the graph.
Note: For more information on zoom, see Using Zoom Controls on page 396.
See also other documents in the category EXFO Measuring instruments:
- ADSL2+ (124 pages)
- ADSL2+ (267 pages)
- ADSL2+ (275 pages)
- ARU-100 HPNA Test Probe (26 pages)
- ARU-100 HPNA Test Software Option for DSL/IP Tests (3 pages)
- AXS-100 Series OTDR (155 pages)
- AXS-200 SharpTESTER (70 pages)
- AXS-200/610 Copper Test Module (152 pages)
- AXS-200/650 IP Triple-Play Test Set (91 pages)
- AXS-200/850 Ethernet Test Set (262 pages)
- CableSHARK P3 VF/DSL Cable Qualifier (321 pages)
- DC0091A (3 pages)
- ELS-500 Light Source (45 pages)
- EOT Series (2 pages)
- EPM-ELS-50 (206 pages)
- ETS-1000 (173 pages)
- ETS-1000G (195 pages)
- ETS-1000L (47 pages)
- EXpert IP Test Tools (62 pages)
- EXpert IPTV Test Tools (FTB-1 / 2 Pro) (82 pages)
- EXpert IPTV Test Tools (FTB-200v2) (82 pages)
- EXpert VoIP Test Tools (107 pages)
- FIP-400 Fiber Inspection Probe and ConnectorMax (78 pages)
- FIP-400B Fiber Inspection Probe Multifiber (2 pages)
- FIP-400B Fiber Inspection Probe and ConnectorMax2 (111 pages)
- FIP-425B/435B Fiber Inspection Probe and ConnectorMax2 Mobile (103 pages)
- FLS-110 Optical Polarized Source (18 pages)
- FLS-300 Light Source (40 pages)
- FLS-5800 CD/PMD Analyzer Source (106 pages)
- FLS-5800 CD/PMD Analyzer Source (98 pages)
- FLS-5800 (6 pages)
- FLS-600 Light Source (79 pages)
- FOA Compatibility (3 pages)
- FOT-5200 Coarse Spectrum Analyzer (47 pages)
- FOT-930 Multifunction Loss Tester (111 pages)
- FTB-5230S Optical Spectrum Analyzer for FTB 200 v2 (659 pages)
- FTB-5230S Optical Spectrum Analyzer for FTB 200 v2 (251 pages)
- FTB -5240S/5240BP Optical Spectrum Analyzer (638 pages)
- FTB-1 (234 pages)
- FTB-2 Pro (6 pages)
- FTB-2 Pro (443 pages)
- FTB-200 v2 Compact Modular Platform (222 pages)
- FTB-2200 for FTB-200 v2 (41 pages)
- FTB-3930 MultiTest (101 pages)