Diagnostic graphs – Delta MMC120 User Manual
Page 83

Motion Controller Diagnostic and Setup Program
Graphs
Delta Computer Systems, Inc. 360/254-8688
83
Diagnostic Graphs
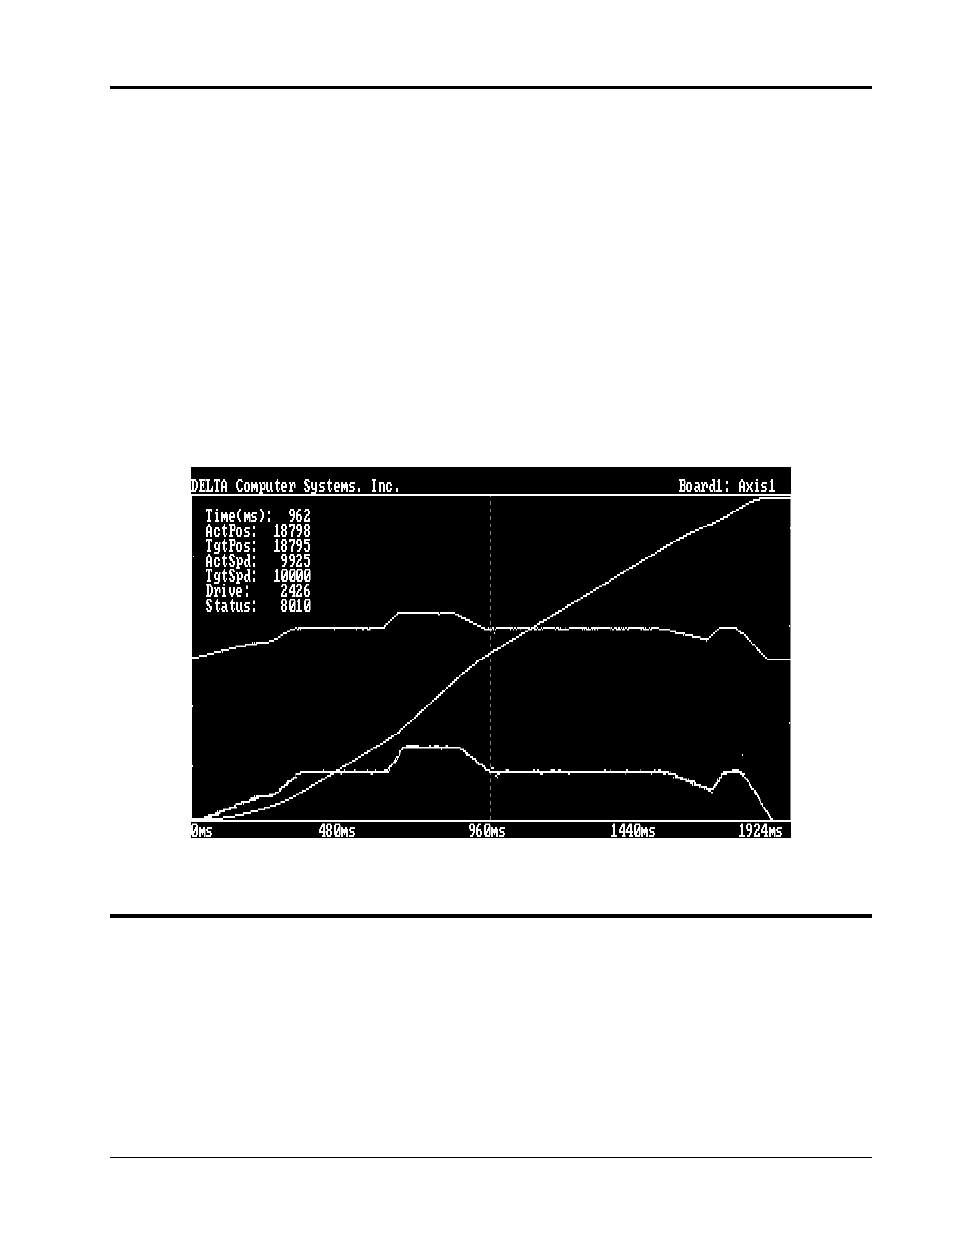
You can see a diagnostic graph after each move started with a “G” or “O” command. The MMC120 acquires data for
each move automatically. Press the INS key to display the graph. Press SHIFT-INS to display the graph with
Command Queue data included.
The graph displays information with the time base specified in the Plot Time field. Entering a 2 in the Axis 1 Plot
Time field causes the module to acquire data for that axis each 2 milliseconds. A value of 10 specifies 10 milliseconds
between data points.
The Home, End, PgUp, PgDn, up arrow and down arrow keys move a vertical cursor across the graph, showing the
values at that point in time for the Actual Position, Target Position, Actual Speed, Target Speed, Status field and Drive
Output. The Tab key moves this text to different locations on the screen (or removes it from the screen) to avoid
covering the plot. The lines on the plot are not labeled, but instead are color coded.
Two plot files are included for demonstration purposes: multi.plt and stall.plt. Multi.plt shows you can change the
requested position, Speed and Acceleration on the fly without first stopping the axis or causing a discontinuity in the
motion. Stall.plt shows how the motion control board tries to keep the Actual and Target Positions together, even after
the Actual Position has stalled.
Multi.plt
Display axis graphic information (uses axis where cursor is currently located)
INS Key
Display axis move datalog in graph form (use
Ctrl-V command
after INS key to display raw data)
SHIFT INS
Graph display plus command data
Home
Move cursor to start of graph
End
Move cursor to end of graph
← ↑
Move cursor back one time interval (fine adjust)
→ ↓
Move cursor forward one time interval (fine adjust)
PgUp
Move cursor back multiple time intervals (coarse adjust)
PgDn
Move cursor forward multiple time intervals (coarse adjust)
