YSI 9600 User Manual
Page 67
Now if you want to return to the data display in which only half the data is shown, use the File|Open Data
Display command, select the DELIMITED designation, and click OK. The delimited data display will
reappear.
You might want to export your custom data presentation to a file which can be imported into spreadsheet
programs such as Excel. Use the File|Export selection and choose the desired format (usually
CDF/WMF), name the file, and press OK to place the spreadsheet compatible file in the same subdirectory
as your data file (usually C:\PROGRAM FILES\NUVIEW\DATA.
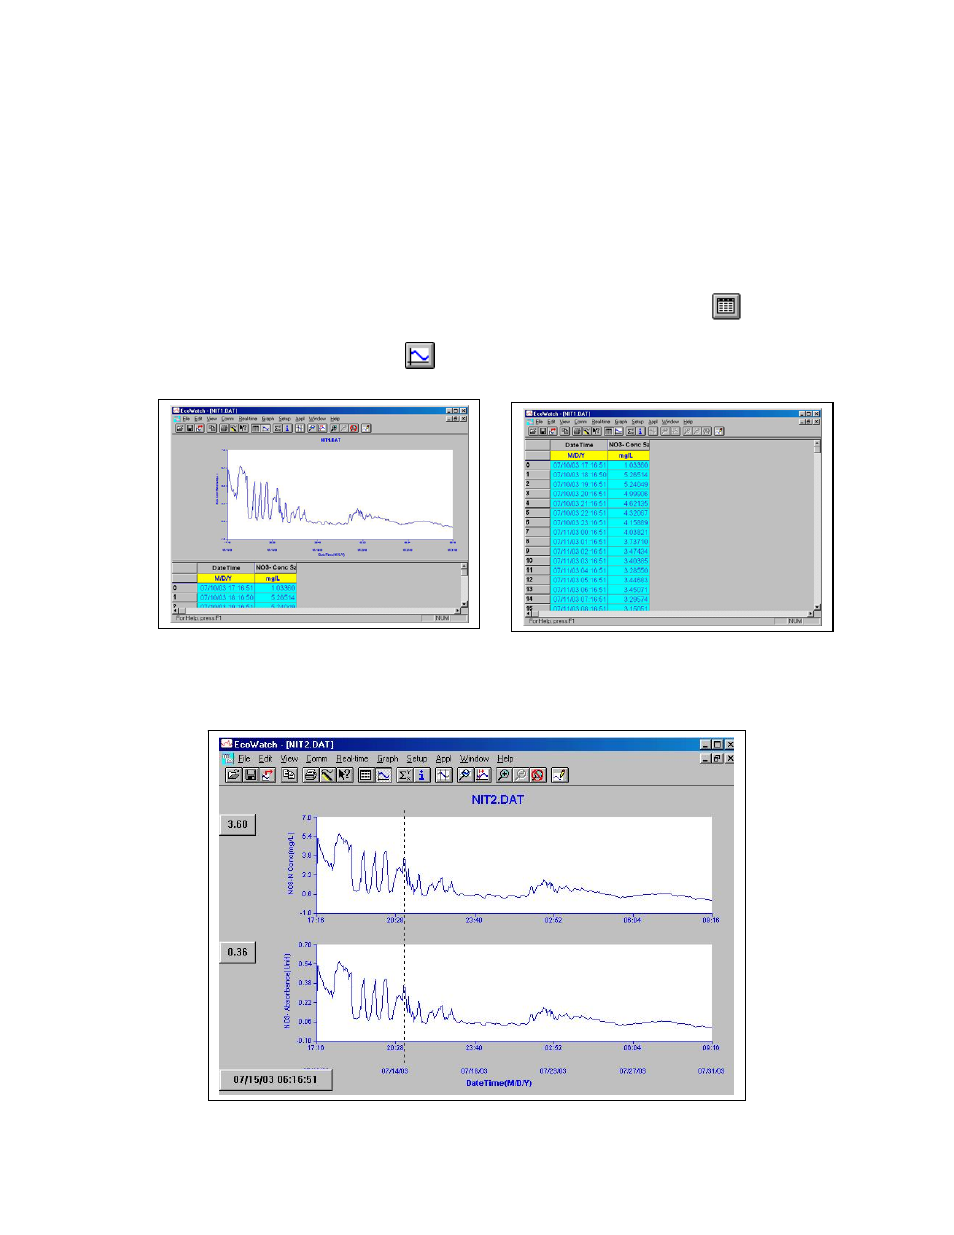
If you want to see the data from your study in table format, click on the “toggle data” icon
in the
toolbar and the display will change to one in which both a graph and a table are present as shown below
left. You can also use the “toggle graph”
to turn the graph completely off and show only the data
table as shown below right.
Finally, you might want to view actual data readings at any time in the graph display. This can be carried
out by placing the cursor on the plot and holding down the right mouse button while moving the cursor
from left to right. As shown in the data display below, the values of all parameters at a particular time are
shown in boxes at the left edge of the graph.
YSI Environmental
67
Model 9600 Nitrate Monitor