Metrohm 781 pH/Ion Meter User Manual
Page 110
7.2 Reports
100
780/781 pH/Ion Meter, Manual
If a whole series of measured values is to be documented then this is
done by selecting under
CONFIG/Print meas. values
the option
Report header: once
. In this way the report header will be printed
out once with the first measured value. Each further time that the
ed out:
#2 pH = 8.185 21.2 °C (Pt1000)
2004-05-28 17:01:56
#3 pH = 8.187 21.2 °C (Pt1000)
2004-05-28 17:02:56
#4 pH = 8.188 21.2 °C (Pt1000)
2004-05-28 17:03:56
#5 pH = 8.189 21.2 °C (Pt1000)
2004-05-28 17:04:56
Such a series of measured values can also be produced automatically
by selecting the print criterion '
time
'.
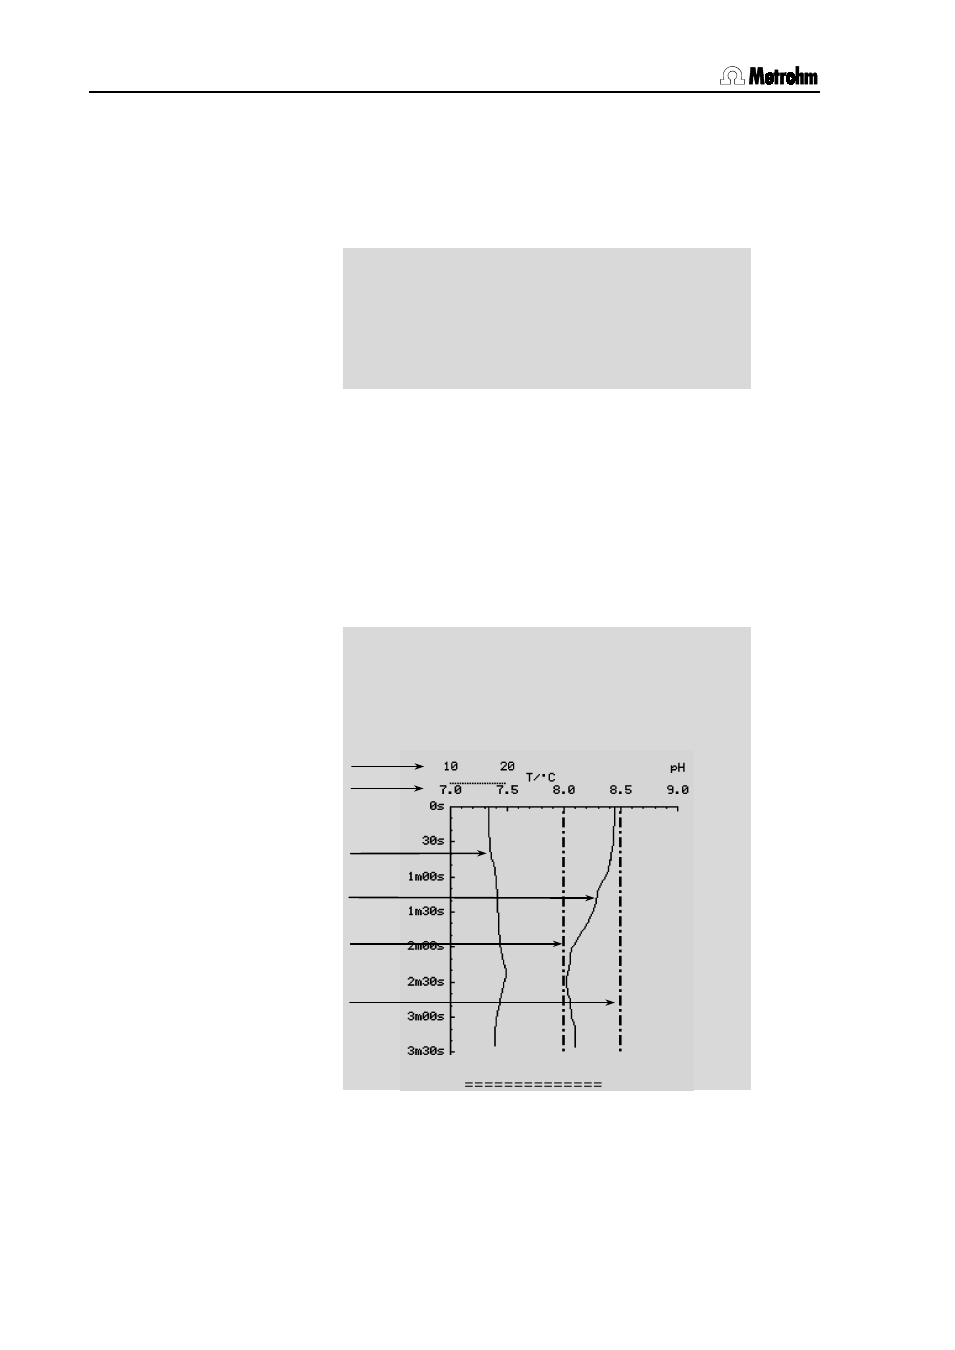
With the print criterion 'plot' the measured values are given out as a
graphical plot in the direct measurement types. As well as configuration
under
CONFIG/print meas.value
, the scales of the measured values
curves must be set under
PARAMETER/plot parameters
(see
plot
parameters
in Section 6.2 to Section 6.5). In the pH and Conc(direct)
modes the measured temperature can also be shown in the same plot
as a secondary measured value in addition to the primary measured
value, pH or concentration:
'mp
781 pH/Ion Meter
01104 5.781.0020
date 2004-05-28 17:00:56
user
C. Weber
pH pH-1 run number
9
electr.id
pH electr.01
Temperature scale
pH scale
Temperature curve
pH curve
lower limit pH
upper limit pH