Startup log – Rockwell Automation 1756-HIST2G FactoryTalk Historian ME 2.2 User Manual
Page 213
10 • U
SING
W
EB
D
IAGNOSTICS
203
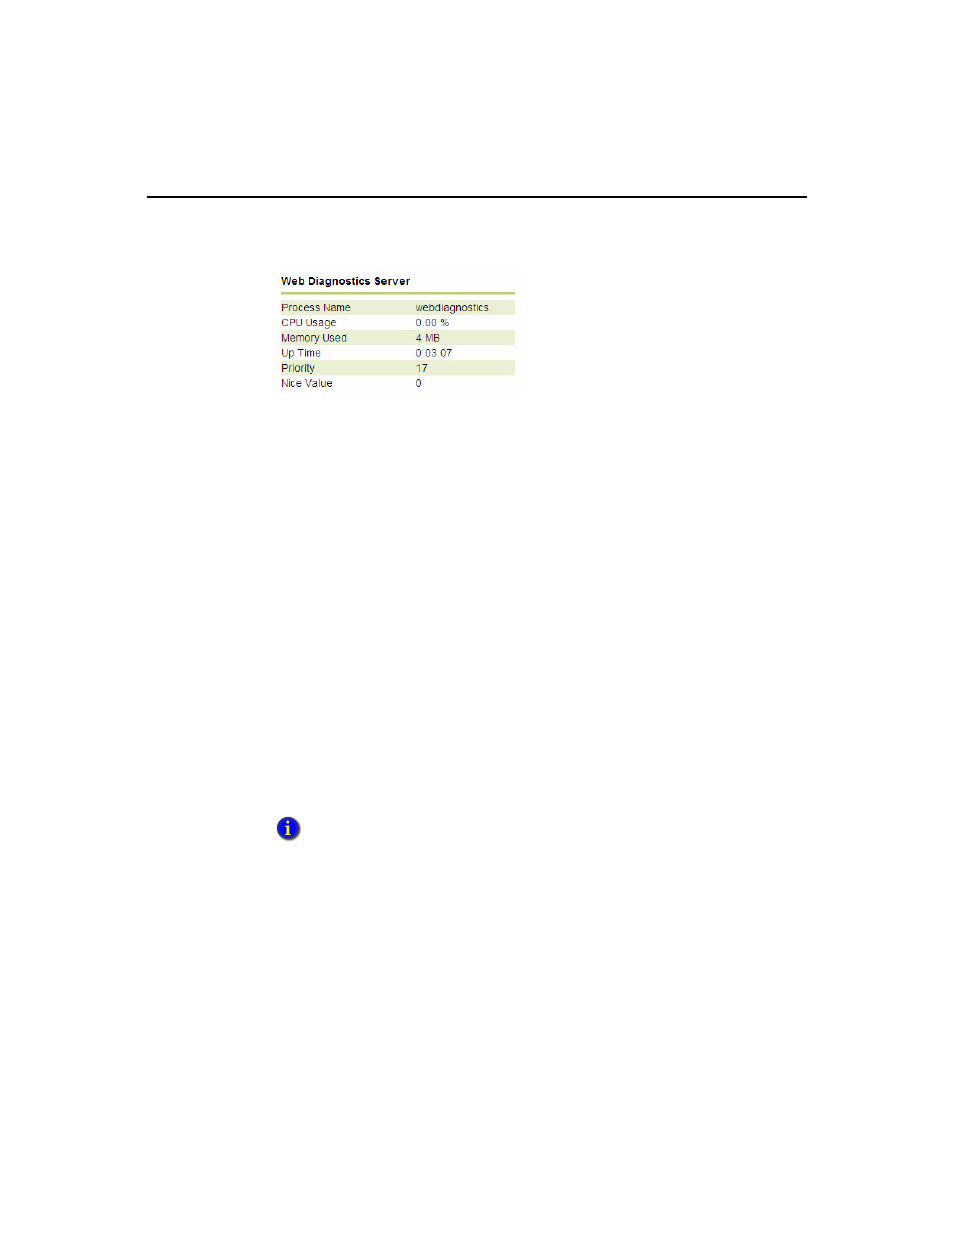
The Web Diagnostics Server page lists the following information:
Process Name - the title of the process.
CPU Usage - the percent of CPU utilization.
Memory Used - the amount of memory (in megabytes) utilized by the web
diagnostics server.
Up Time - the amount of CPU time used.
Priority - indicates the precedence order for the process.
Nice Value - a value that indicates the CPU process priority. The default value is
zero. A high Nice value indicates a lower priority for the process. Negative Nice
values are higher priority.
Startup Log
Each time the module is rebooted, the time, source (server), and message are recorded
in the startup log. To access the page, click Firmware in the top navigation bar of the
Web Diagnostics interface, and then click Startup Log in the left navigation bar.
To search the startup log, enter the time parameters, the source you want to search for,
and the maximum number of records you want the search to return. Click [Search].
See “Start and End Times” for more details about time options.