Controlbus statistics – Rockwell Automation 1756-HIST2G FactoryTalk Historian ME 2.2 User Manual
Page 199
10 • U
SING
W
EB
D
IAGNOSTICS
189
The Controller Statistics page provides information about Logix Controllers in the
chassis.
Slot Number - the chassis slot in which the Logix Controller is installed.
Application Name - the name of the program running on the Logix Controller.
Fault Status - the Logix Controller’s current fault status is one of the following:
No Fault
Minor Fault
Major Fault
Total Active Points - the total number of active tags between the module and this
controller.
Point Event Rate/Sec - the number of tag reads from this controller, per second,
accumulated over a rolling 10 second period. Therefore, the value is the average
tag reads per second over the previous 10 seconds.
Point Failure Rate/Sec - the number of tag read failures from this controller, per
second, accumulated over a rolling 10 second period. Therefore, the value is the
average tag read failures per second over the previous 10 seconds.
CPU Loading - the controller's CPU utilization in tenths of a percent. For
example, the range of 0 - 100 representing 0 to 100%.
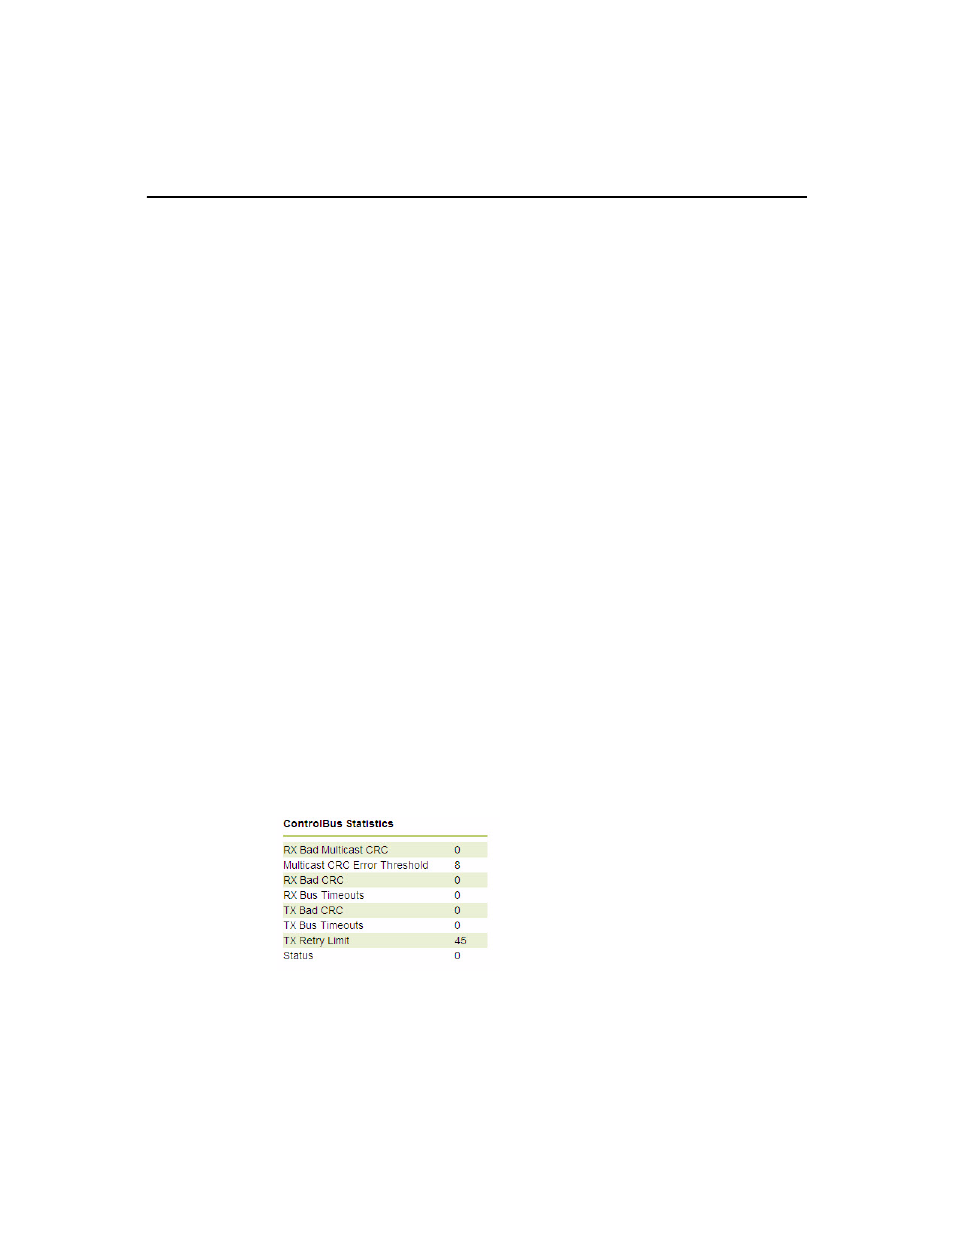
ControlBus Statistics
The ControlBus Statistics page provides general status and diagnostic-related
information about the ControlLogix backplane. To access the page, click Hardware
in the top navigation bar of the Web Diagnostics interface, and then click
ControlBusStatistics in the left navigation bar.