4 bar graph representation, 3 operation and visualization – JUMO 706560 LOGOSCREEN es Operating Manual User Manual
Page 41
41
3 Operation and visualization
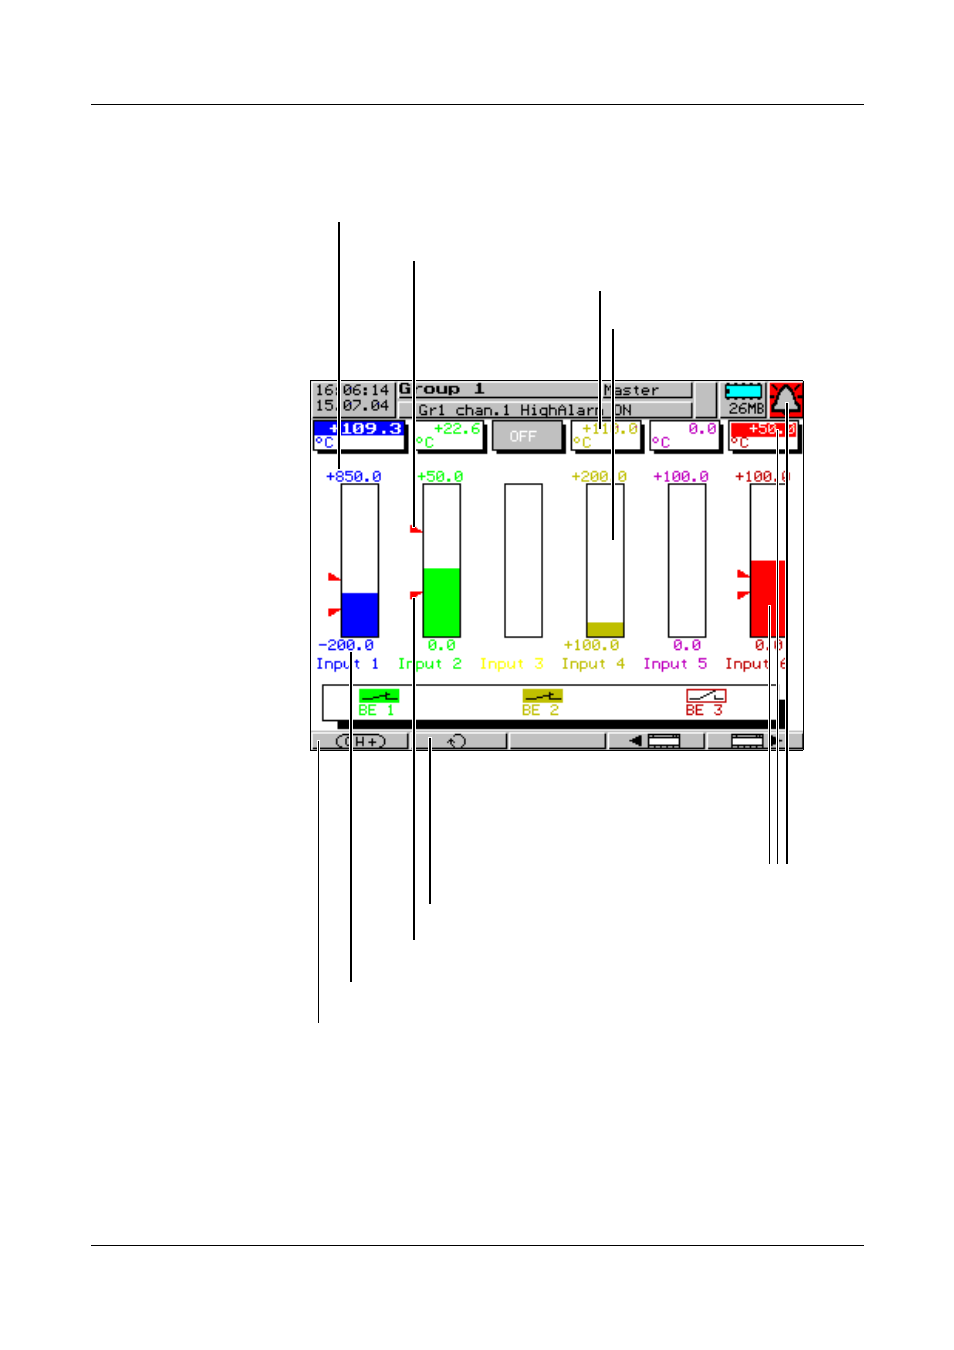
3.2.4 Bar graph representation
In bar graph representation, the latest measurements of the group are shown
as bar graphs, in addition to the numerical display.
Scaling end
Latest measurement (numerical)
Latest measurement as bar graph
Upper limit index
Out-of-limit
On out-of-limit, the color changes to red.
The alarm bell flashes and the numerical
measurement is shown on a red
background.
Low limit index
Scaling start
Select next channel
Switch to the next active group
See also other documents in the category JUMO Equipment:
- 7050xx mTRON T - System description (10 pages)
- 705040 mTRON T - Router Module Operating Manual (74 pages)
- 705040 mTRON T - Router Module Installation Instructions (34 pages)
- 705030 mTRON T - Digital Input/Output Module Data Sheet (7 pages)
- 705030 mTRON T - Digital Input/Output Module Operating Manual (50 pages)
- 705021 mTRON T - Analog Input Module, 8-Ch. Data Sheet (8 pages)
- 705021 mTRON T - Analog Input Module, 8-Ch. Operating Manual (56 pages)
- 705020 mTRON T - Analog Input Module, 4-Ch. Data Sheet (10 pages)
- 705020 mTRON T - Analog Input Module, 4-Ch. Operating Manual (70 pages)
- 705015 mTRON T - Relay Module 4-Ch. Data Sheet (5 pages)
- 705015 mTRON T - Relay Module 4-Ch. Operating Manual (44 pages)
- 705010 mTRON T - Multichannel Controller Module Data Sheet (15 pages)
- 705010 mTRON T - Multichannel Controller Module Operating Manual (148 pages)
- 705001 mTRON T - Central Processing Unit Data Sheet (10 pages)
- 705001 mTRON T - Central Processing Unit Operating Manual (152 pages)
- 705060 mTRON T - Multifunction Panel 840 Data Sheet (13 pages)
- 705060 mTRON T - Multifunction Panel 840 Operating Manual (272 pages)
- 709062 TYA 202 - Three-Phase Power Controller Data Sheet (17 pages)
- 709062 TYA 202 - Three-Phase Power Controller Operating Manual (112 pages)
- 709061 TYA 201 - Single-Phase Power Controller Data Sheet (21 pages)
- 709061 TYA 201 - Single-Phase Power Controller Operating Manual (112 pages)
- 709050 IPC IGBT Power Converter Data Sheet (12 pages)
- 709050 IPC IGBT Power Converter IPC 200A Operating Manual (52 pages)
- 709050 IPC IGBT Power Converter IPC 70/100A Operating Manual (52 pages)
- 709050 IPC IGBT Power Converter IPC 70A Operating Manual (48 pages)
- 709040 TYA-110 thyristor power unit Data Sheet (12 pages)
- 709040 TYA-110 thyristor power unit Operating Manual (56 pages)
- 709020 TYA-432 thyristor power switch Data Sheet (5 pages)
- 709010 TYA-432 thyristor power switch Data Sheet (3 pages)
- 706585 LOGOSCREEN fd Data Sheet (21 pages)
- 706585 LOGOSCREEN fd Operating Instructions (108 pages)
- 706585 LOGOSCREEN fd Operating Manual (228 pages)
- 706585 LOGOSCREEN fd Recorder with diecast zinc front Installation Instructions (40 pages)
- 706585 LOGOSCREEN fd Recorder with stainless steel front Installation Instructions (52 pages)
- 706581 LOGOSCREEN nt Data Sheet (18 pages)
- 706581 LOGOSCREEN nt Operating Instructions (108 pages)
- 706581 LOGOSCREEN nt Operating Manual (224 pages)
- 706581 LOGOSCREEN nt Paperless Recorder with TFT display, CompactFlash Installation Instructions (36 pages)
- 706581 LOGOSCREEN nt stainless steel front Installation Instructions (48 pages)
- 706560 LOGOSCREEN es Data Sheet (12 pages)
- 706560 LOGOSCREEN es Operating Instructions (64 pages)
- 706560 LOGOSCREEN es Installation Instructions (32 pages)
- 706510 LOGOSCREEN 500 cf Data Sheet (10 pages)
- 706510 LOGOSCREEN 500 cf Operating Manual (140 pages)