Apple Numbers '09 User Manual
Page 159
Chapter 7
Creating Charts from Data
159
4
To add shadows, do one of the following:
To add shadows to individual bars, choose Individual from the Shadow
Â
pop-up menu.
To add shadows to each group of bars, choose Group from the Shadow
Â
pop-up menu.
To set shadow attributes, use the Graphic inspector. See “
Â
Adding Shadows” on
page 223 for instructions.
5
To show series names, click Axis and then choose Show Series Names from the Choose
Axis Options pop-up menu for Category Axis.
To learn about other formatting options, see “Formatting Charts” on page 143.
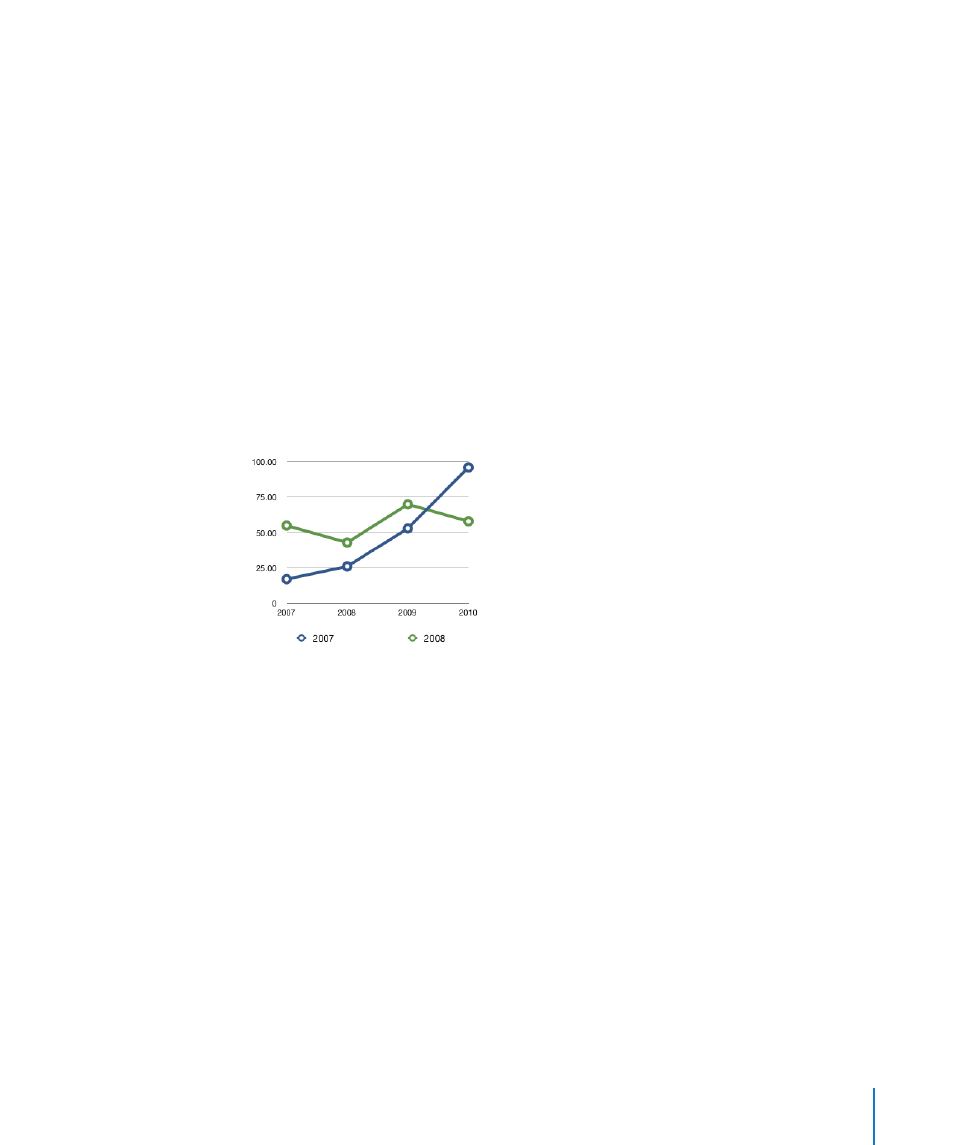
Customizing Data Point Symbols and Lines in Line Charts
In area and line charts, you can use symbols (circles, triangles, squares, and diamonds)
to represent data points. You can also show a straight or curved line between the
data points.
You can use the format bar to quickly customize symbols and lines. Select a symbol
and use the Symbol and Size controls to format symbols. Use the Stroke controls to
format the lines. The Chart inspector provides additional options.
Here are ways to change the data point symbols and connecting line using the
Chart inspector:
To change the data point symbol, select a data series (area shape or line), click
m
Inspector in the toolbar, click the Chart inspector button, and then click Series. Choose
a symbol from the Data Symbol pop-up menu. Adjust the size of the data point
symbols by entering a value or using the stepper in the adjacent field.
To join points with a curve, select a data series (line), and then choose Curve from the
m
Connect Points pop-up menu.
To change the line color, select a line, click Inspector in the toolbar, click the Graphic
m
inspector button, and then use the Stroke controls.
To learn about other formatting options, see “Formatting Charts” on page 143.