Showing error bars in charts – Apple Numbers '09 User Manual
Page 151
Chapter 7
Creating Charts from Data
151
Fraction: Displays data point values less than 1 as one integer over another. (If your
values are greater than 1, you won’t see any fractional representation of your data.)
Choose how accurately you want the fractions rounded in the Accuracy pop-up menu.
Choosing an option such as Halves or Quarters represents the values as a portion of
the total pie, rounded to the nearest division you selected.
Scientific: Displays data point values in scientific notation, where 10 raised to a power
is represented as E+ an integer. In the Decimals field, specify how many decimal places
you want to show.
Custom: Choose a custom number format you’ve already created, or create a new
one. See “Using Your Own Formats for Displaying Values in Table Cells” on page 101 for
more information.
To change the color and texture of series elements, or format data point symbols and
value labels, use the Series pane of the Chart inspector. See “Formatting the Elements
in a Chart’s Data Series” on page 148.
To learn about formatting options that are unique to a given chart type, see
“Formatting Specific Chart Types” on page 154.
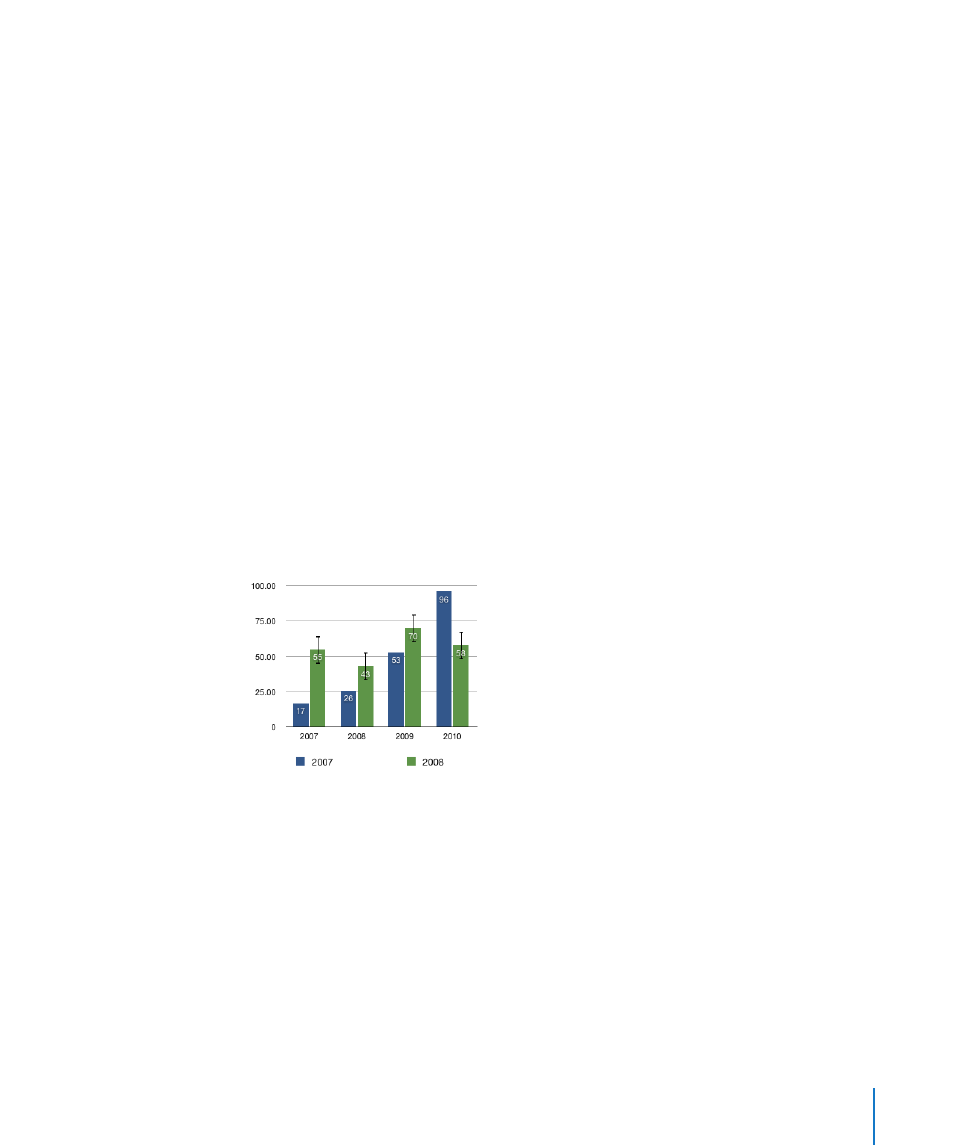
Showing Error Bars in Charts
You can show error bars around data points in all 2D charts, except for pie charts. Error
bars indicate how much error there might be in a particular data point.
To show error bars for the data points in a selected series:
1
In the Chart inspector, click Series, and then click Advanced at the bottom of the
Inspector window. Then click Error Bars.
For scatter plots, you can have error bars for both data series. Set them separately by
following the instructions for both the axes.
2
From the pop-up menu, choose the way you want the error bars to be displayed:
Positive and Negative: Displays full error bars, both above and below each data point.
Positive Only: Displays only the part of each error bar that falls above its data point.
Negative Only: Displays only the part of each error bar that falls below its data point.