Apple Numbers '09 User Manual
Page 149
Chapter 7
Creating Charts from Data
149
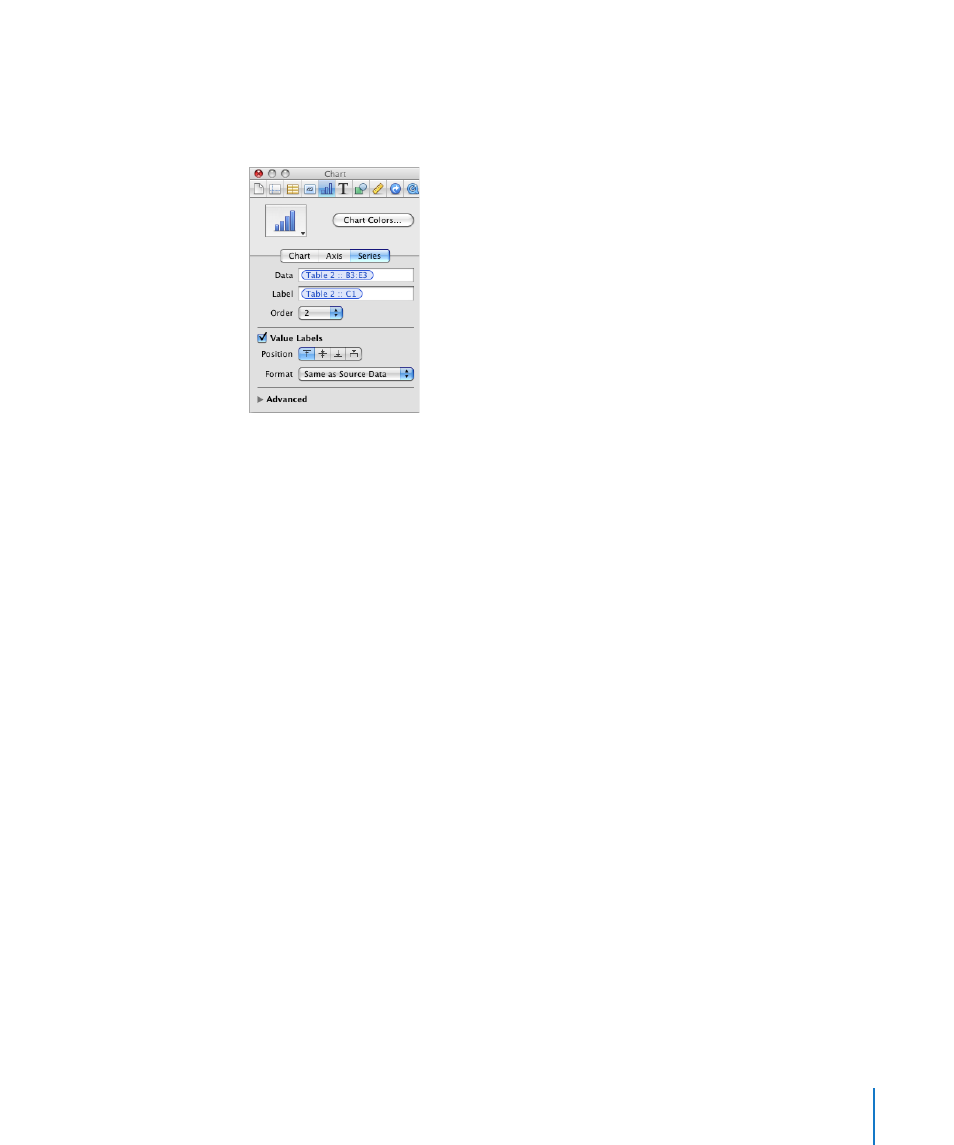
Many options are available using the Chart inspector. For example, for bar, column, and
area charts, you can make formatting selections to change the look and style of data
series shapes and symbols in the Series pane of the Chart inspector after selecting an
element in the series you want to change.
To fill selected series elements with specially designed colors or textures using the
Chart inspector:
1
Select a column, a bar, or another series element you want to format.
2
Click Inspector in the toolbar, click the Chart inspector button, and then click
Chart Colors.
3
Choose a fill type (for example, 3D Texture Fills) from the first pop-up menu.
4
Choose a fill collection (for example, Marble or Wood) from the second pop-up menu.
5
Do one of the following:
To fill all the elements in all the data series, click Apply All. The first fill is applied
Â
to elements in the first series, the second fill to elements in the second series, and
so on.
To fill elements in a single data series, drag the fill to an element (bar, column, and
Â
so on) in the series.
Note that these fills can’t be used for line and scatter charts. To learn about formatting
series elements in these chart types, see “Customizing Data Point Symbols and Lines in
Line Charts” on page 159 and “Using Scatter Charts” on page 160.
To adjust the opacity, stroke, shadow, or fill of selected series elements:
Select the element you want to change, click the Graphic inspector button, and then
m
make the adjustments you want.