1 the histogram window – Triton TargetPro User Manual
Page 45
June 2004 TargetPro™ User's Manual
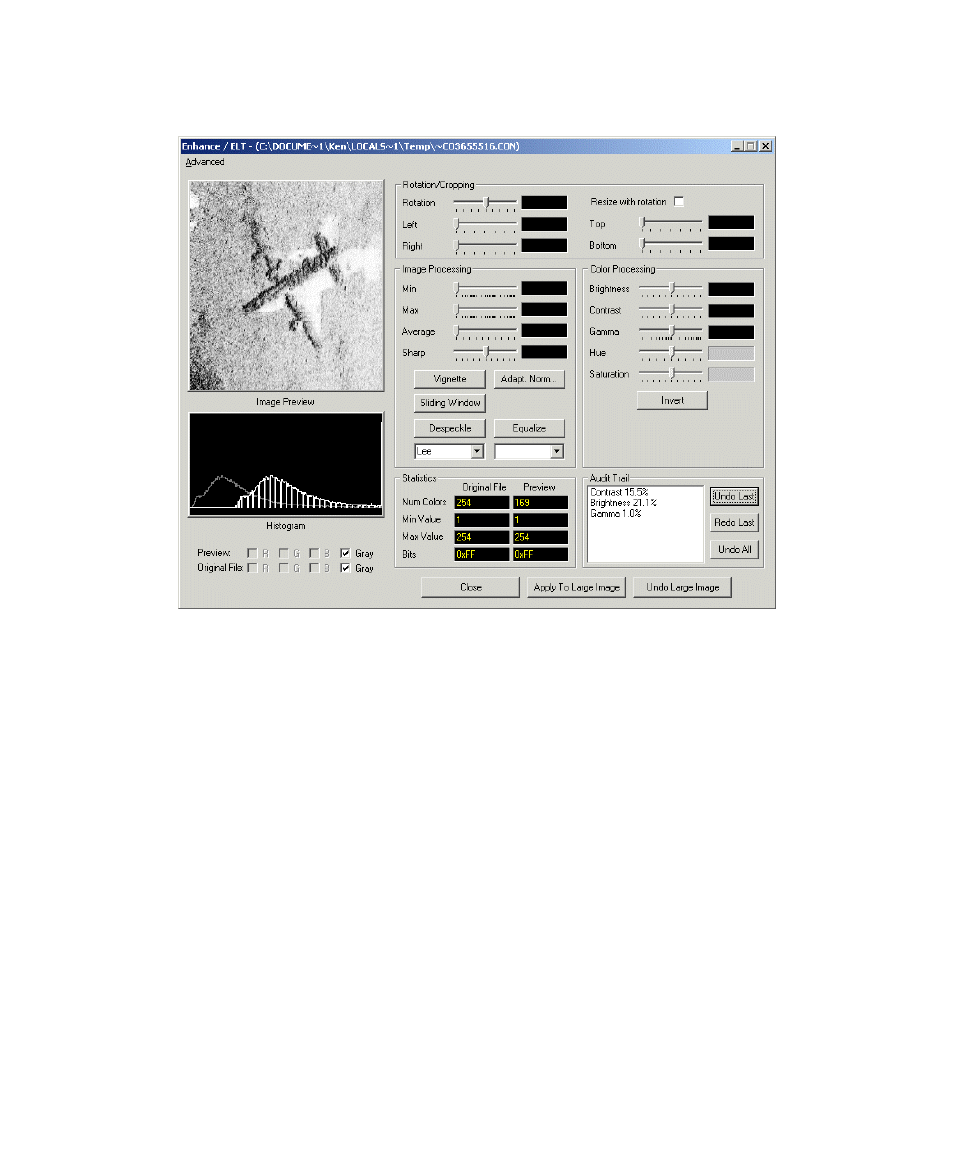
Figure 17. Typical contact copied into the Electronic Light Table.
4.1.1 The Histogram Window
The Histogram window (bottom left window shown in Figure 17) graphs the
dynamic range distribution of the image’s colors for the preview image
(enhanced or not). Thereafter, each instance of a modified image is
graphically superimposed as an information layer in the Histogram window.
Below the Histogram window are two rows labeled Original File and
Preview. The Original File row refers to those values that are present in the
original image before a copy was loaded into the ELT. The Preview row
refers to an image shown in the Image Preview window of the ELT. Such an
image is one that has been loaded into the ELT, down sampled, and then
displayed in the ELT.
Each row has a check box for indicating the presence or absence of red (R),
green (G), blue (B), or Gray colors in the previewed image and in the
original file. (Gray, when checked, identifies a monochromatic image and is
Chapter 4: Object Modification and Classification
34