About the timeline tab – HP Neoview Release 2.4 Software User Manual
Page 79

“Use Tooltips to Show the Value of a Performance Metric” (page 79)
Use Tooltips to Show the Value of a Performance Metric
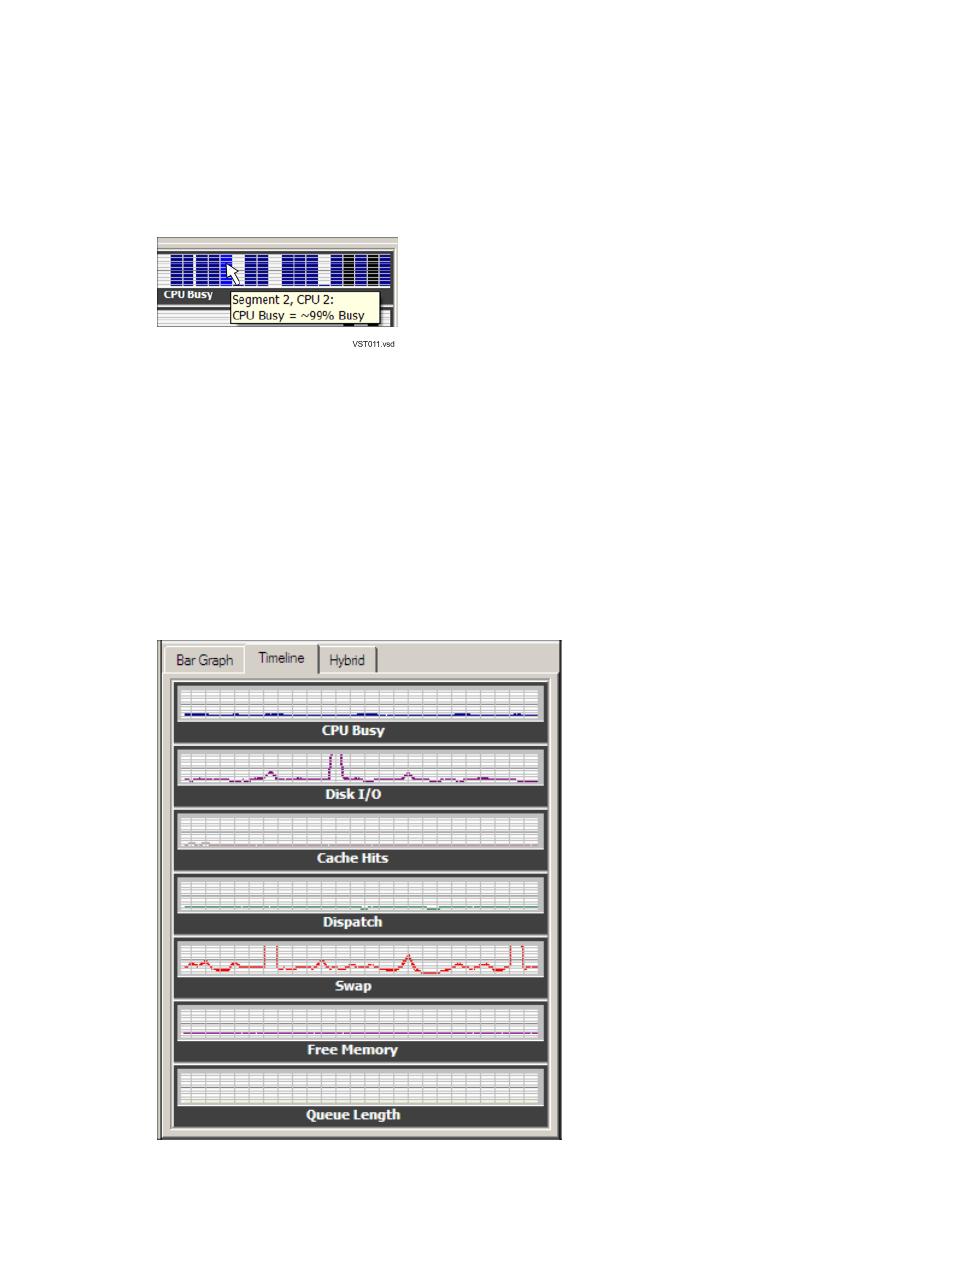
When the system monitor bar graph (Bar Graph tab) is displayed, you can quickly obtain the
current value of a metric for a given segment and CPU. To obtain the current value, hold the
cursor over the bar for the CPU. A tooltip caption shows the segment number, the CPU number,
and the approximate value of the bar at the instant the cursor moved over it:
Terms
About the Timeline Tab
The Timeline tab shows a graph of each performance metric over time. The graph displays the
aggregated (arithmetic mean) value for the entire system over time.
Timelines enable you to see a trend for a given metric over a specified number of data points
(the Max Range). A data point is a 2-second interval. The timeline graph has no units; a vertical
scale is provided only for comparison. The trace lines use the same colors as the bar graph bars
in the Bar Graph tab. You can configure the number of data points, the background color, and
the trace line colors.
Related Topics
“Configure System Monitor Options” (page 82)
Use Tooltips to Show the Value of a Performance Metric
79
