HP Neoview Release 2.4 Software User Manual
Page 101

NOTE:
Click once; you do not need to double-click.
For example
Click
or...
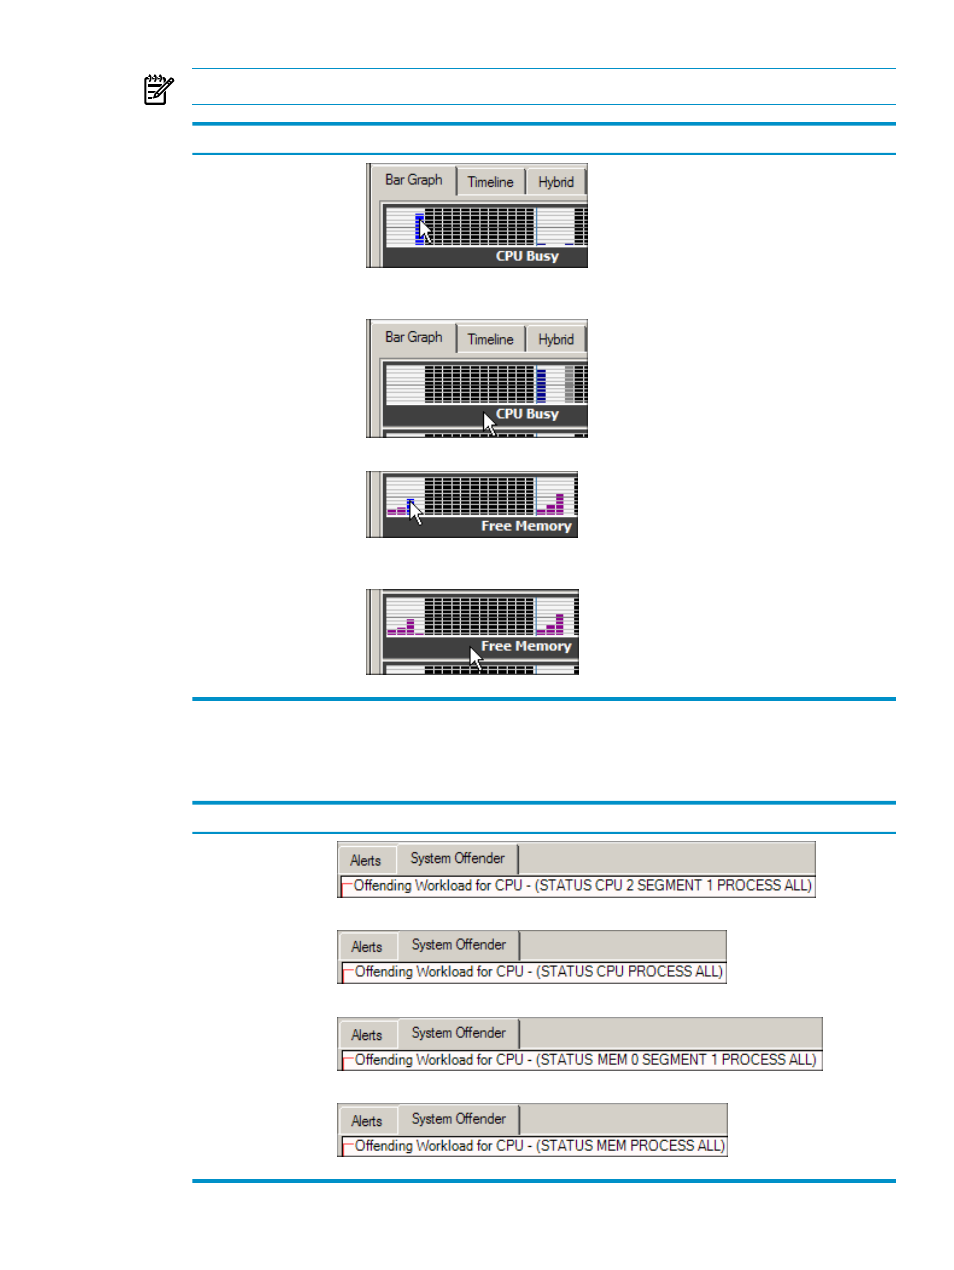
Click any CPU bar or
header for these
performance metrics:
–CPU Busy
–Disk I/O
–Cache Hits
–Dispatch
–Queue Length
or...
Click any CPU bar or
header for these
performance metrics:
–Free Memory
–Swap
The System Offender tab displays a list of processes for the specified CPU (or all CPUs).
The area you click in the System Monitor determines the System Offender active command.
For example:
The System Offender shows the active command as
When you click . . .
A CPU for a
CPU-related metric
A header for a
CPU-related metric
A CPU for a
memory-related
metric
A header for a
memory-related
metric
Find Offending Processes and Queries
101
See also other documents in the category HP Software:
- Scripting Toolkit for Linux (68 pages)
- Scripting Toolkit for Windows 9.50 (62 pages)
- Scripting Toolkit for Windows 9.60 (62 pages)
- Storage Area Manager (13 pages)
- Core HP-UX (5 pages)
- Matrix Operating Environment Software (138 pages)
- Matrix Operating Environment Software (137 pages)
- Matrix Operating Environment Software (97 pages)
- Matrix Operating Environment Software (33 pages)
- Matrix Operating Environment Software (142 pages)
- Matrix Operating Environment Software (189 pages)
- Matrix Operating Environment Software (58 pages)
- Matrix Operating Environment Software (68 pages)
- Matrix Operating Environment Software (79 pages)
- Matrix Operating Environment Software (223 pages)
- Matrix Operating Environment Software (136 pages)
- Matrix Operating Environment Software (34 pages)
- Matrix Operating Environment Software (63 pages)
- Matrix Operating Environment Software (67 pages)
- Matrix Operating Environment Software (128 pages)
- Matrix Operating Environment Software (104 pages)
- Matrix Operating Environment Software (75 pages)
- Matrix Operating Environment Software (245 pages)
- Matrix Operating Environment Software (209 pages)
- Matrix Operating Environment Software (71 pages)
- Matrix Operating Environment Software (239 pages)
- Matrix Operating Environment Software (107 pages)
- Matrix Operating Environment Software (77 pages)
- Insight Management-Software (148 pages)
- Matrix Operating Environment Software (80 pages)
- Insight Management-Software (128 pages)
- Matrix Operating Environment Software (132 pages)
- Matrix Operating Environment Software (74 pages)
- Matrix Operating Environment Software (76 pages)
- Matrix Operating Environment Software (233 pages)
- Matrix Operating Environment Software (61 pages)
- Matrix Operating Environment Software (232 pages)
- Matrix Operating Environment Software (70 pages)
- Matrix Operating Environment Software (120 pages)
- Matrix Operating Environment Software (36 pages)
- Matrix Operating Environment Software (99 pages)
- Matrix Operating Environment Software (192 pages)
- Matrix Operating Environment Software (198 pages)
- Matrix Operating Environment Software (66 pages)
- Matrix Operating Environment Software (95 pages)
