Table 4 topology display switch and status icons, Displaying the event browser, 4 topology display switch and status icons – HP McDATA 4Gb SAN Switch for HP BladeSystem p-Class User Manual
Page 43
McDATA® 4Gb SAN Switch for HP p-Class BladeSystem user guide
43
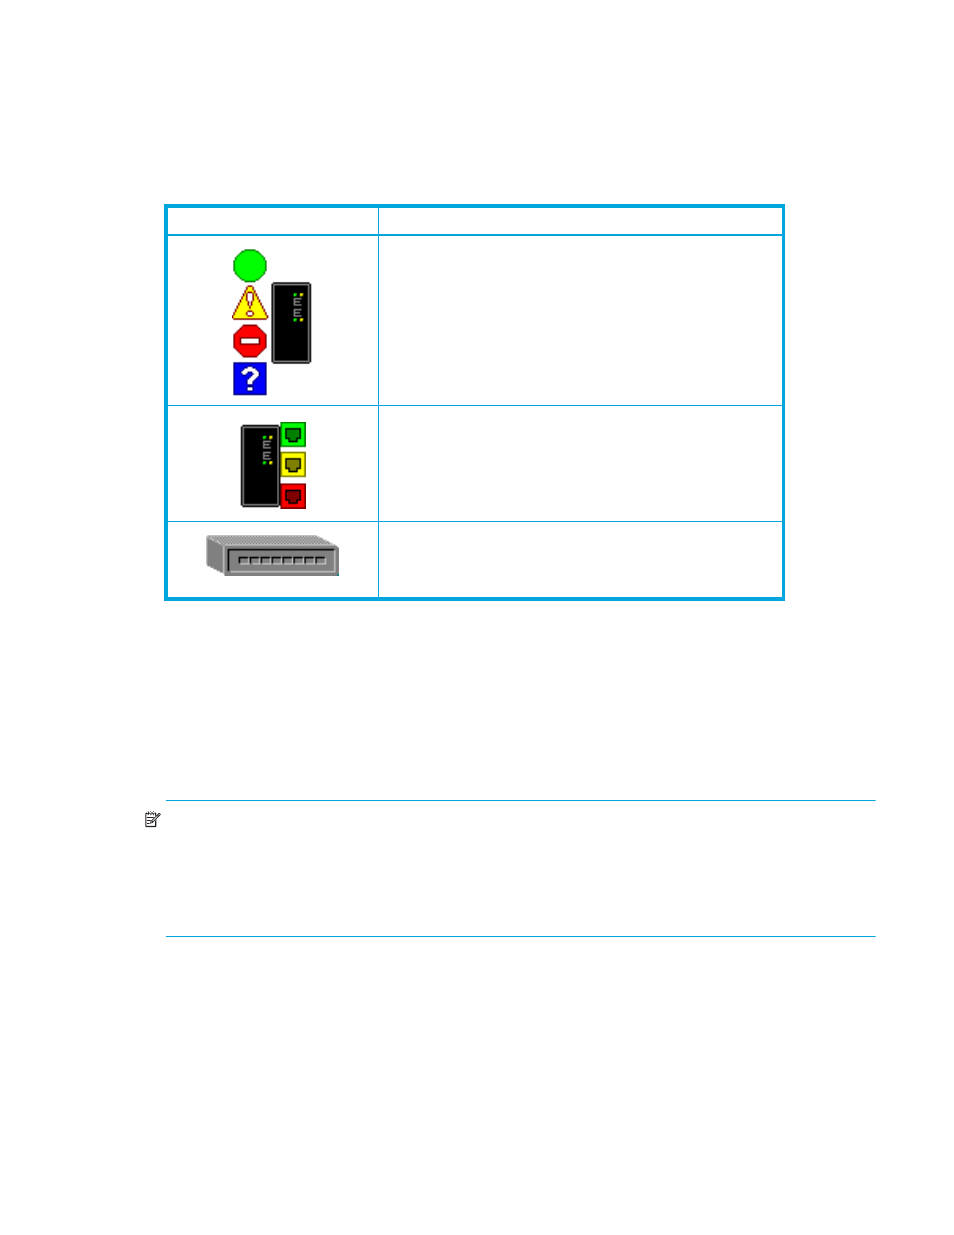
The topology display uses switch and status icons to provide status information about switches, inter-switch
links, and the Ethernet connection. The switch status icons, displayed on the left side of a switch, vary in
shape and color. Switches controlled by an Ethernet Internet Protocol have a colored Ethernet icon
displayed on the right side of the switch. A green Ethernet icon indicates normal operation, yellow
indicates a condition that may require attention to maintain maximum performance, and red indicates a
shows the different switch icons and their meanings.
Displaying the Event Browser
The Event Browser displays a list of events generated by the switches in the fabric and the switch
management application. Events that are generated by the application are not saved on the switch, but
can be saved to a file during the switch management session.
To display the Event Browser, choose one of the following:
•
Select Fabric > Show Event Browser.
•
Click Events on the tool bar.
NOTE:
If the Show Event Browser selection or the Events button is grayed-out, you must first enable the
Events Browser using the Preferences dialog. Refer to ”
Setting McDATA Web Server preferences
page 15 for more information. If the Event Browser is enabled using the Preferences dialog, the next time
the switch management application is started, all events from the switch log will be displayed. If the Event
Browser is disabled when switch management application is started and later enabled, only those events
from the time the Event Browser was enabled and forward will be displayed.
Table 4
Topology display switch and status icons
Switch icon
Description
McDATA 4Gb SAN Switch
•
Normal operation (green)
•
Warning — operational with errors (yellow)
•
Critical — potential failure (red)
•
Unknown — communication status unknown,
unreachable, or not manageable by the McDATA Web
Server (blue)
Fabric management switch
•
Ethernet connection normal (green)
•
Ethernet connection warning (yellow)
•
Ethernet connection critical (red)
Switch is not manageable with this version of McDATA
Web Server. Use the management application that was
shipped with this switch.