KYORITSU 6305 Instruction Manual User Manual
Page 102
8.5
KEW6305
● Demand measurement with this instrument
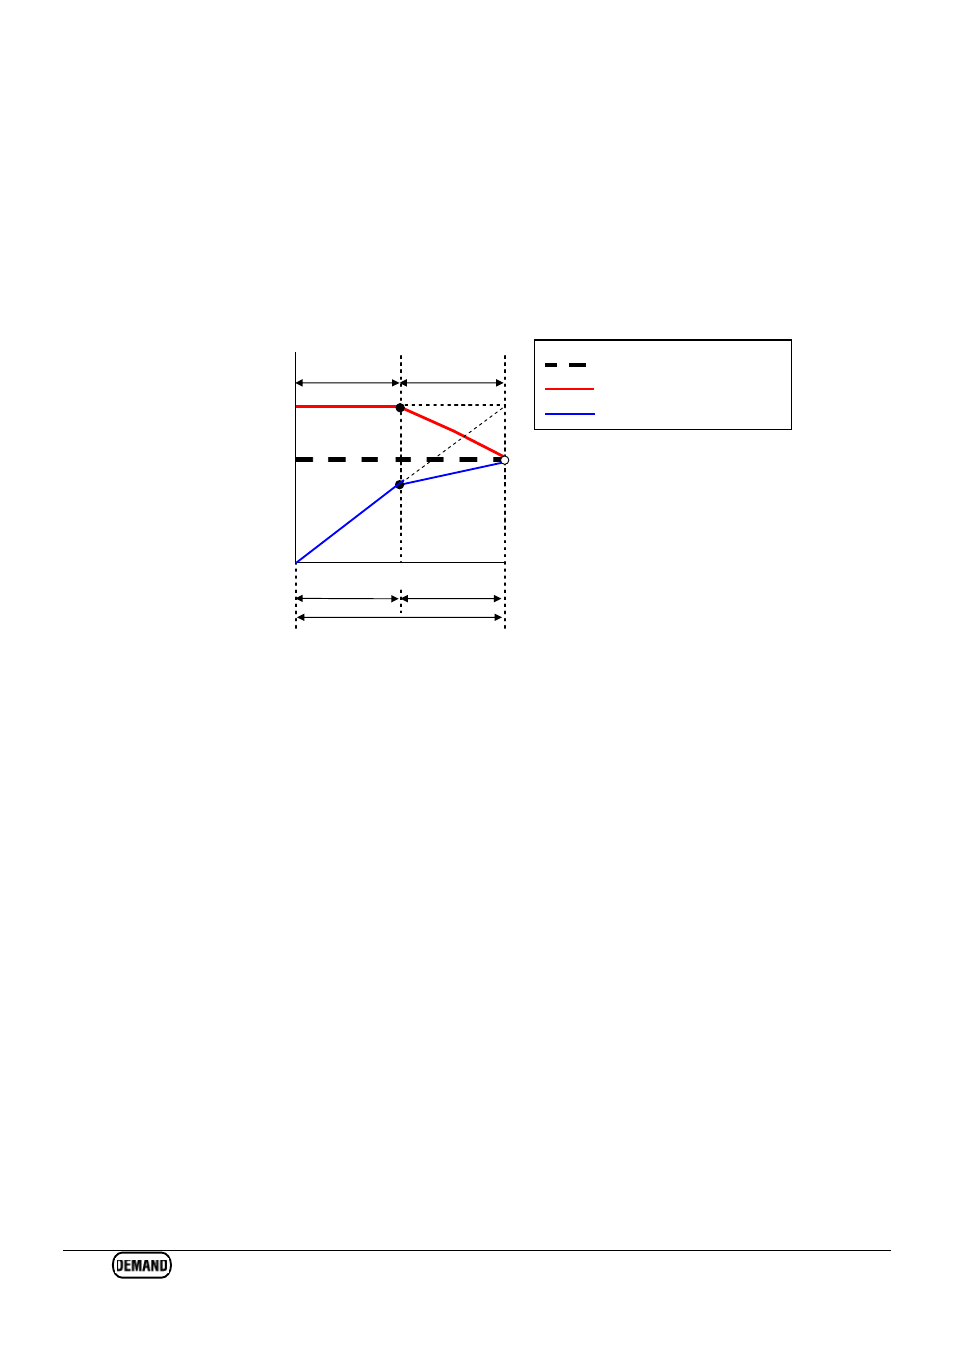
By measuring loads, the KEW6305 can display the present and predicted average power(demand
value). These values are continuously updated as time elapses during a particular interval.
The buzzer will sound when a predicted demand value exceeds a target demand value after the
elapse of the preset inspection cycle.
The value which is displayed at the end of an interval (in this case, 30 min.) is the average power
(Demand value) for the interval.
The figure below describes the relationship between: Target demand value, Predicted value, Present
demand value, interval and inspection cycle
(kW) 600kW
400kW
600
500
Demand value
0
15
30(min.)
* In this case, the demand value at the end of the interval is 500kW.
The demand values calculated at each interval are useful for power management per day, month or year.
NOTE
* The readings of the demand meter installed by the power company and the KEW6305, may not match
completely due to a time-lag in the start of intervals.
D
e
m
a
n
d
m
e
a
s
u
r
e
-
m
e
n
t
c
y
Demand warning cycle
Target demand value
Predicted demand value
Actual value