1 demand measurement – KYORITSU 6305 Instruction Manual User Manual
Page 101
KEW6305
8.4
8-1 Demand measurement
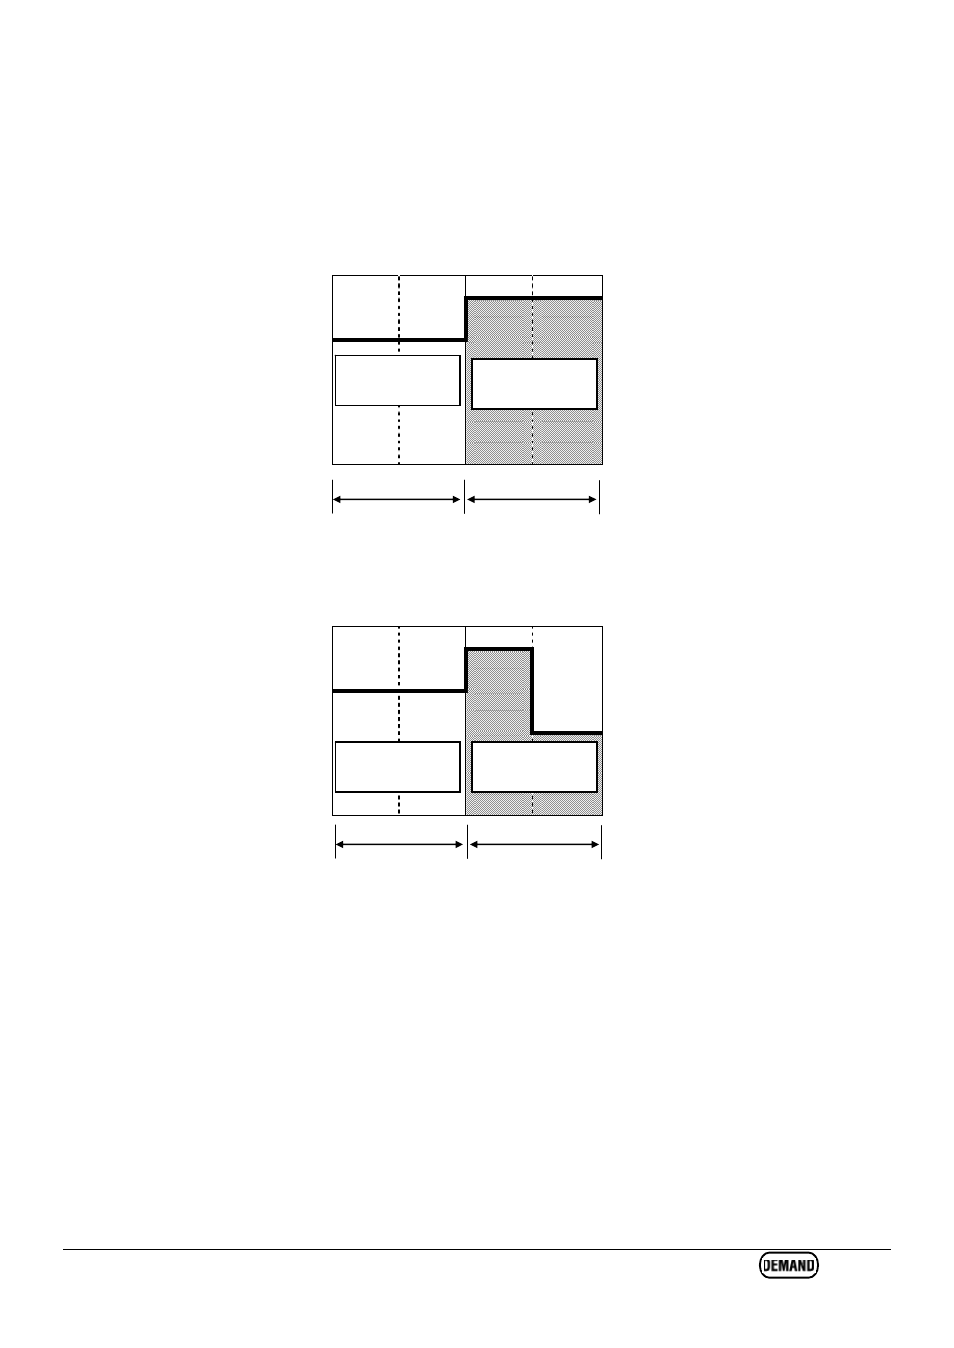
The following is an example of power management by monitoring the demand.
● Reducing the average power during a specific interval
Assume the interval to be 30mins.
In the figure below, the average power during Interval 1 is assumed to be 500kW and during Interval 2
is assumed to be 600kW.
(kW)
600kW
600kW
500kW 500kW
0
15 30 15
30(min.)
Now, assume that the average power during the first 15 min. (the inspection cycle) of Interval 2 is
600kW. The average power during Interval 2 can be maintained at 500kW (same as Interval 1) by
reducing the power of the last 15 min. to 400kW.
(kW)
600kW
500kW 500kW
400kW
0
15 30 15
30(min.)
If say, the average power during the first 15 min. is 1000kW then the average power during the
second 15min should be 0kW to maintain an average power of 500kW.
Average power
600kW
Interval 1
Interval 2
Average power
500kW
Interval 1
Interval 2
Average power
500kW
Average power
500kW