20.2 Interface statistics
261
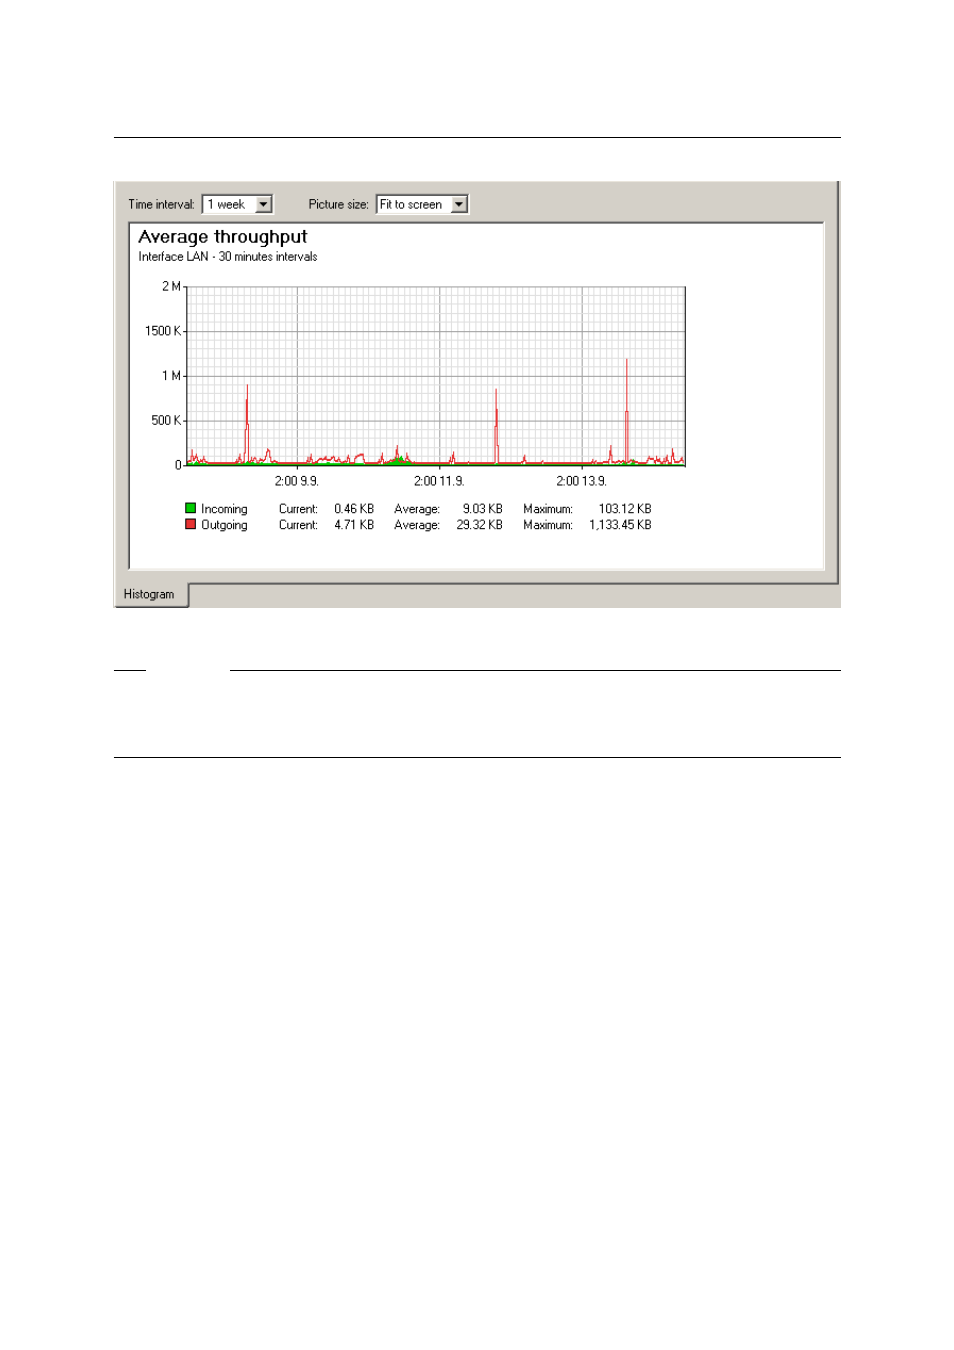
Figure 20.5
Chart informing about average throughput at the interface
Example
Suppose the 1 day interval is selected. Then, an impulse unit is represented by 5 minutes.
This means that every 5 minutes an average traffic speed for the last 5 minutes is recorded in
the chart.