Operator’s manual, Spacing quality bargraph, Return system active delay – Great Plains DICKEY-john MVT Monitor Operator User Manual
Page 90
OPERATOR’S MANUAL
IntelliAg MVT
11001-1643-201401
CUSTOMIZING THE WORK SCREEN / 81
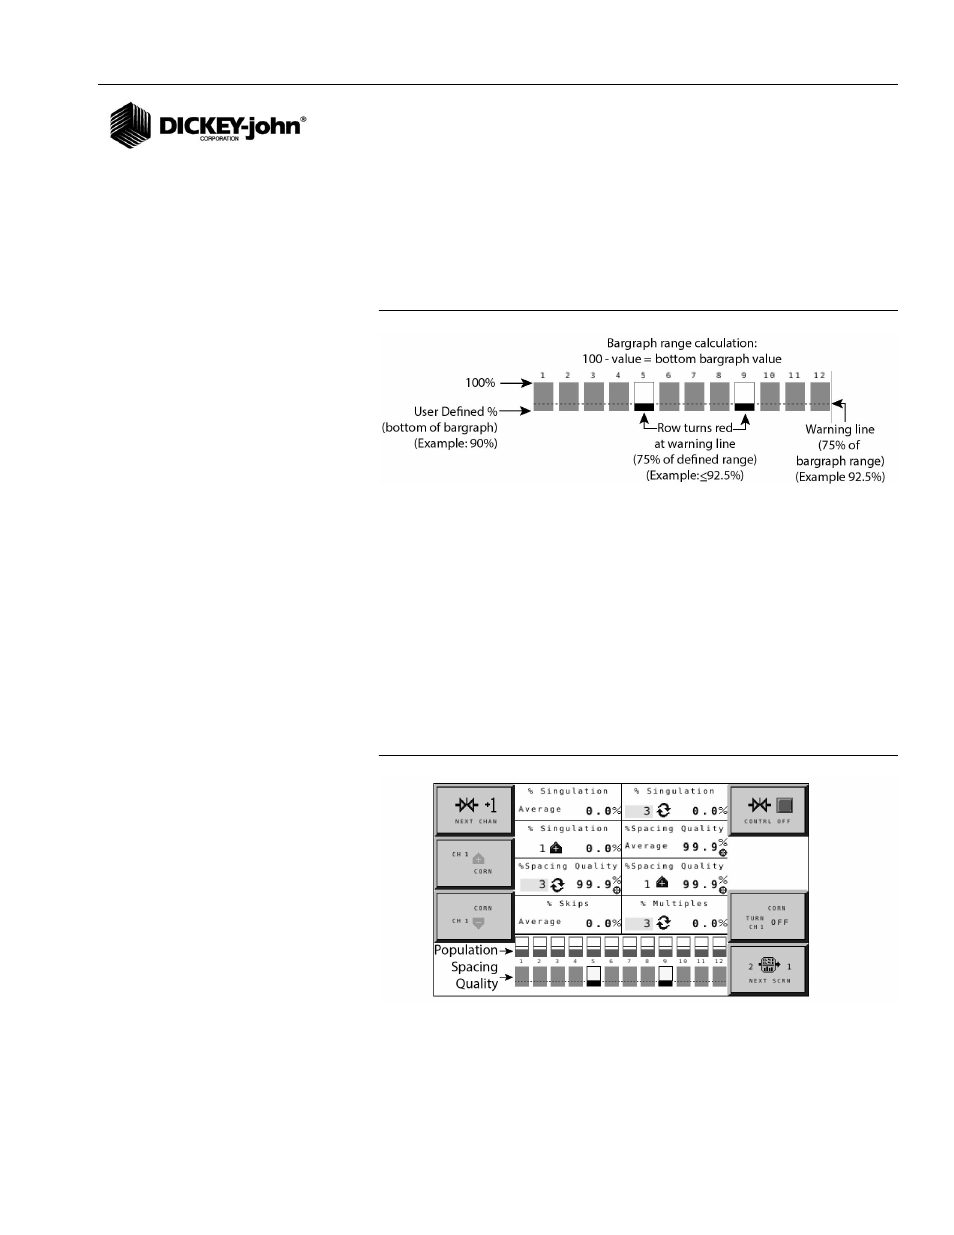
SPACING QUALITY BARGRAPH
Spacing quality reflects how much spacing is occurring between each seed
while planting and provides a comparison of row-to-row meter performance.
Ideal conditions are equal spacing between each seed (100%). As spacing
becomes less uniform and more random, the spacing quality percentage
decreases and falls below 100%.
Figure 68
Spacing Quality Bargraph
Seed shape, meter type, meter settings, seeding rate, seed bed preparation
and vehicle speed are all factors that can affect overall spacing quality.
Spacing quality values can display as a data item and/or as a bargraph on
the Main Operate screen. (
Figure 69
) depicts spacing quality as a bargraph
and seed singulation, spacing quality %, skips, and multiples as data items.
To enable Spacing Quality Data Items and/or Bargraph:
1. To enable the spacing quality bargraph, enter the user-defined
percentage to set the bargraph range for spacing quality per row or
refer to the Data Items and Function section to display as a data item
on the Main Work screen.
– Seed singulation maximum is 72 rows of seed input
Figure 69
Spacing Quality as a Bar Graph
RETURN SYSTEM ACTIVE DELAY
Setting a time delay (seconds) in the Return System Active Delay input box
will trigger the IntelliAg Main Work screen to automatically return as the
active screen view when other system application screens are used.