HP 49g+ User Manual
Page 397
Page 12-20
• The cursor is now in the
Indep
field. Press
³~‚t @@@OK@@@ to
change the independent variable to
θ.
• Press L@@@OK@@@ to return to normal calculator display.
• Press „ò, simultaneously if in RPN mode, to access the PLOT
window (in this case it will be called PLOT –POLAR window).
• Change the H-VIEW range to –8 to 8, by using
8\@@@OK@@@8@@@OK@@@, and the V-VIEW range to -6 to 2 by using
6\@@@OK@@@2@@@OK@@@.
Note: the H-VIEW and V-VIEW determine the scales of the display
window only, and their ranges are not related to the range of values
of the independent variable in this case.
• Change the
Indep Low
value to 0, and the High value to 6.28 (
≈ 2π), by
using:
0@@@OK@@@ 6.28@@@OK@@@.
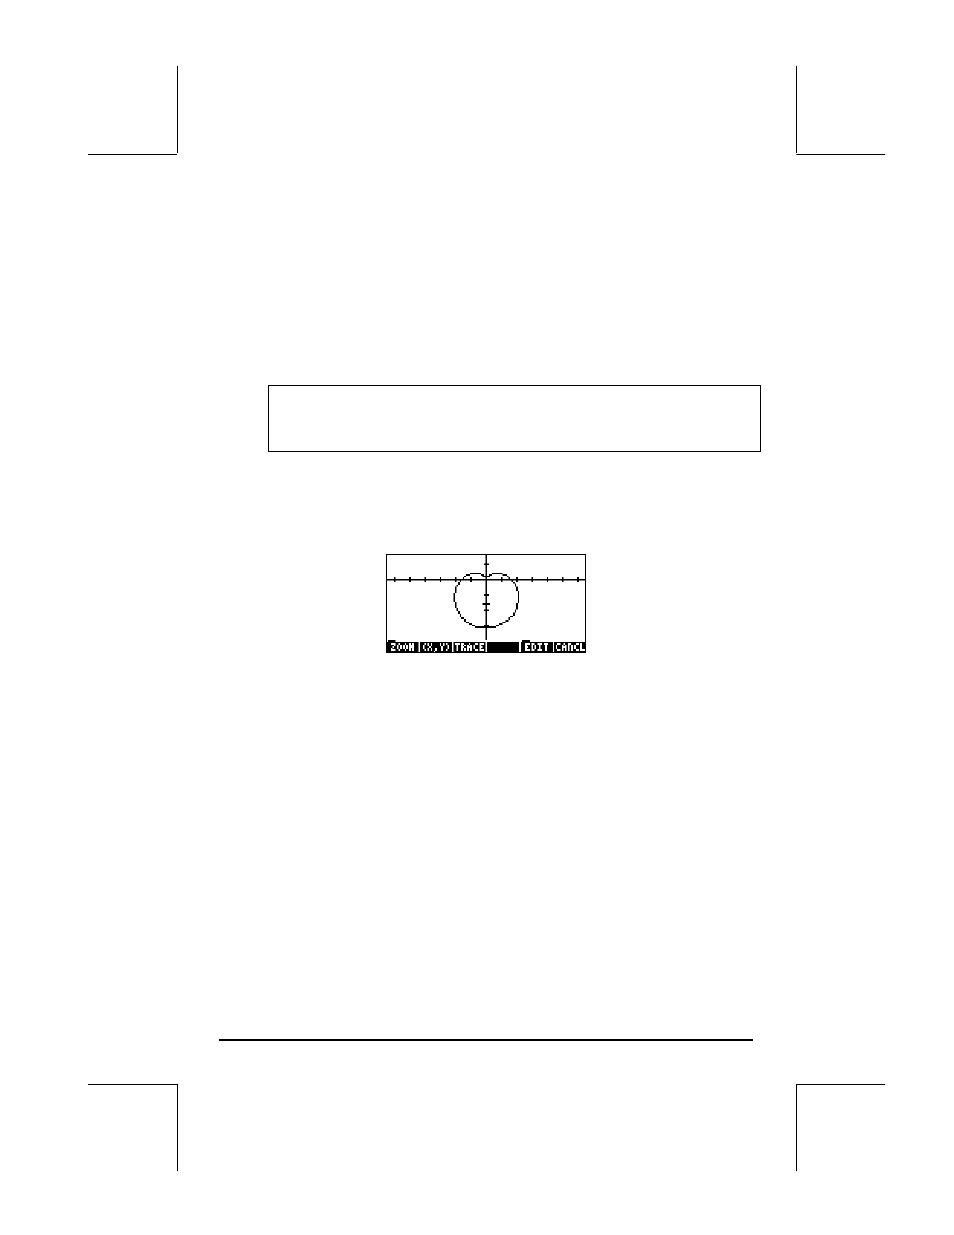
• Press @ERASE @DRAW to plot the function in polar coordinates. The result is a
curve shaped like a hearth. This curve is known as a cardiod (
cardios
,
Greek for heart).
• Press @EDIT L @LABEL @MENU to see the graph with labels. Press L to
recover the menu. Press
L @)PICT to recover the original graphics menu.
• Press @TRACE @x,y@ to trace the curve. The data shown at the bottom of
the display is the angle
θ and the radius r, although the latter is labeled Y
(default name of dependent variable).
• Press L@CANCL to return to the PLOT WINDOW screen. Press L@@@OK@@@
to return to normal calculator display.
In this exercise we entered the equation to be plotted directly in the PLOT
SETUP window. We can also enter equations for plotting using the PLOT
window, i.e., simultaneously if in RPN mode, pressing
„ñ. For
example, when you press
„ñ after finishing the previous exercise, you