2 current phasors display, Hold, Phas – CIRCUTOR CVMk2 Series User Manual
Page 95: Data
95
CVM
k2
DISPLA
Y
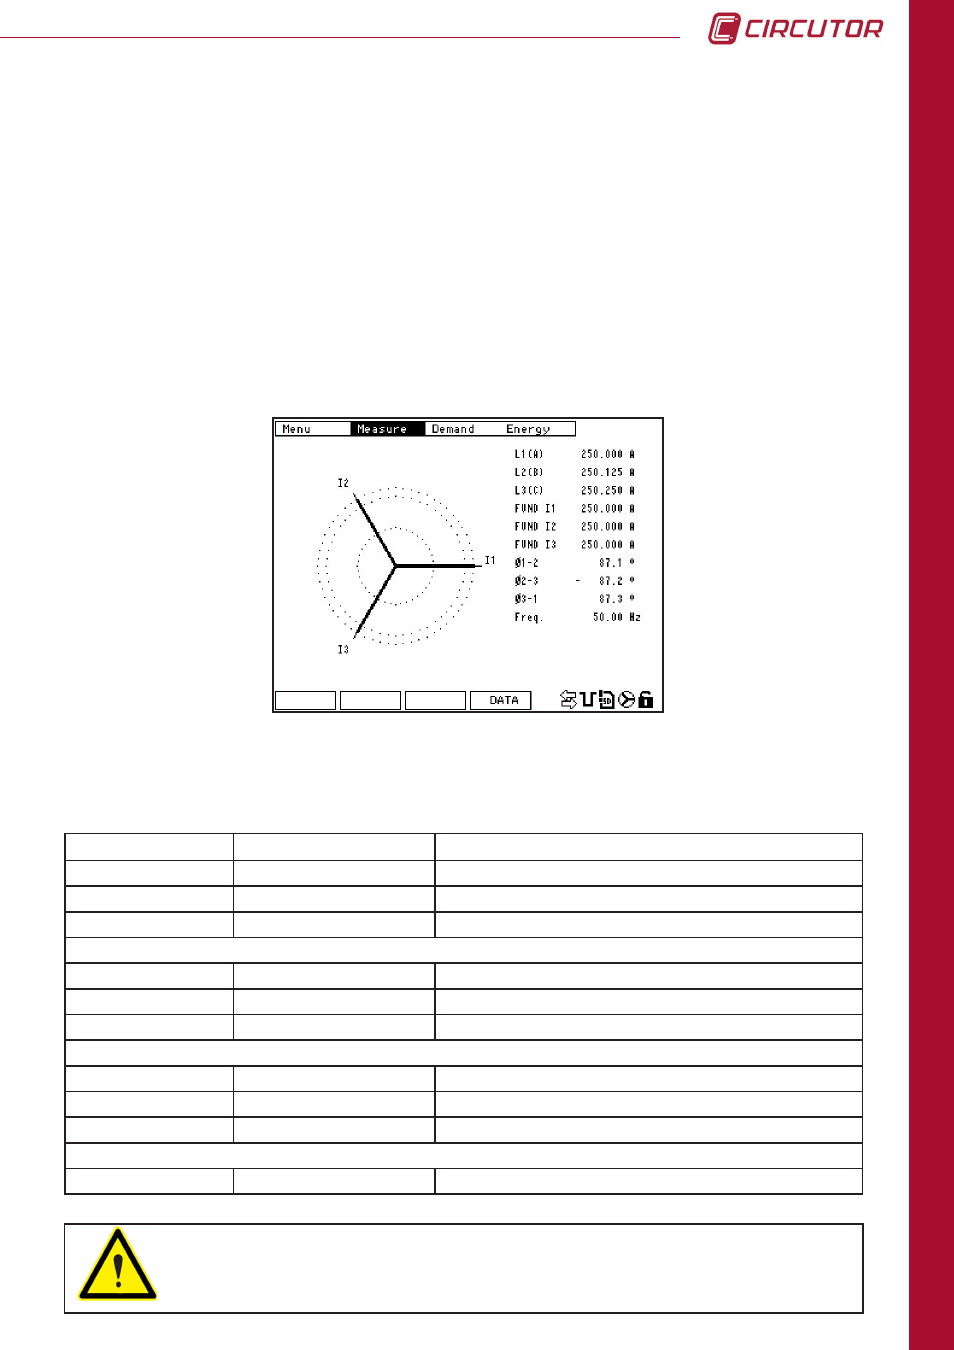
6.1.4.2 Current phasors display
Phasors are graphically displayed in this figure. A table of the most representative numeric
values is also displayed on this screen.
TEXT
VALUE
DESCRIPTION
L1
240.0
RMS value for line 1.
L2
239.8
RMS value for line 2.
L3
240.1
RMS value for line 3.
I1 FUND
235.2
Value of the phase 1 fundamental.
I2 FUND
233.5
Value of the phase 2 fundamental.
I3 FUND
235.6
Value of the phase 3 fundamental.
Ø 1-2
120.4 º
Angular difference between phases 1 and 2.
Ø 2-3
120.4 º
Angular difference between phases 2 and 3.
Ø 3-1
119.2 º
Angular difference between phases 3 and 1.
Freq:
50.14
Frequency of the phases (phase 1).
WARNING: It is only possible to navigate through the top menu using the
right/left arrow buttons in the numeric display screen (6.1.4.).
Hold
: This option takes a screen shot of the waveform currently being viewed.
The
Run
button permits returning to the continuous waveform display mode.
Phas
: This access the phasors graphical display screen. The phasors display screen only
gives the
data
(F4) option on the bottom menu. Pressing
data
will return the user to
the screen that displays the variables' real time numeric values. (See Section 6.1.4.)