LINK Systems 5100-8 Tonnage & Analog Signal Monitor User Manual
Page 35
Doc
#:
L-802-1110 Page
33 Rev.
02
SEND GRAPH
Softkey
This softkey allows the user to send the tonnage graph to a laptop, the LinkNet
network, or to a reference graph depending on the configuration of the system.
See section 3.5.6 on page 37 for details.
SHOW REF
GRAPH / HIDE REF
GRAPH Softkey
If a reference graph has been stored for the job, this softkey will appear and
toggles the display of the reference graph on the screen.
GRAPH SETTINGS
Softkey
This softkey brings up the tonnage monitor graph settings screen. See section
3.6 on page 40 for more information on this screen.
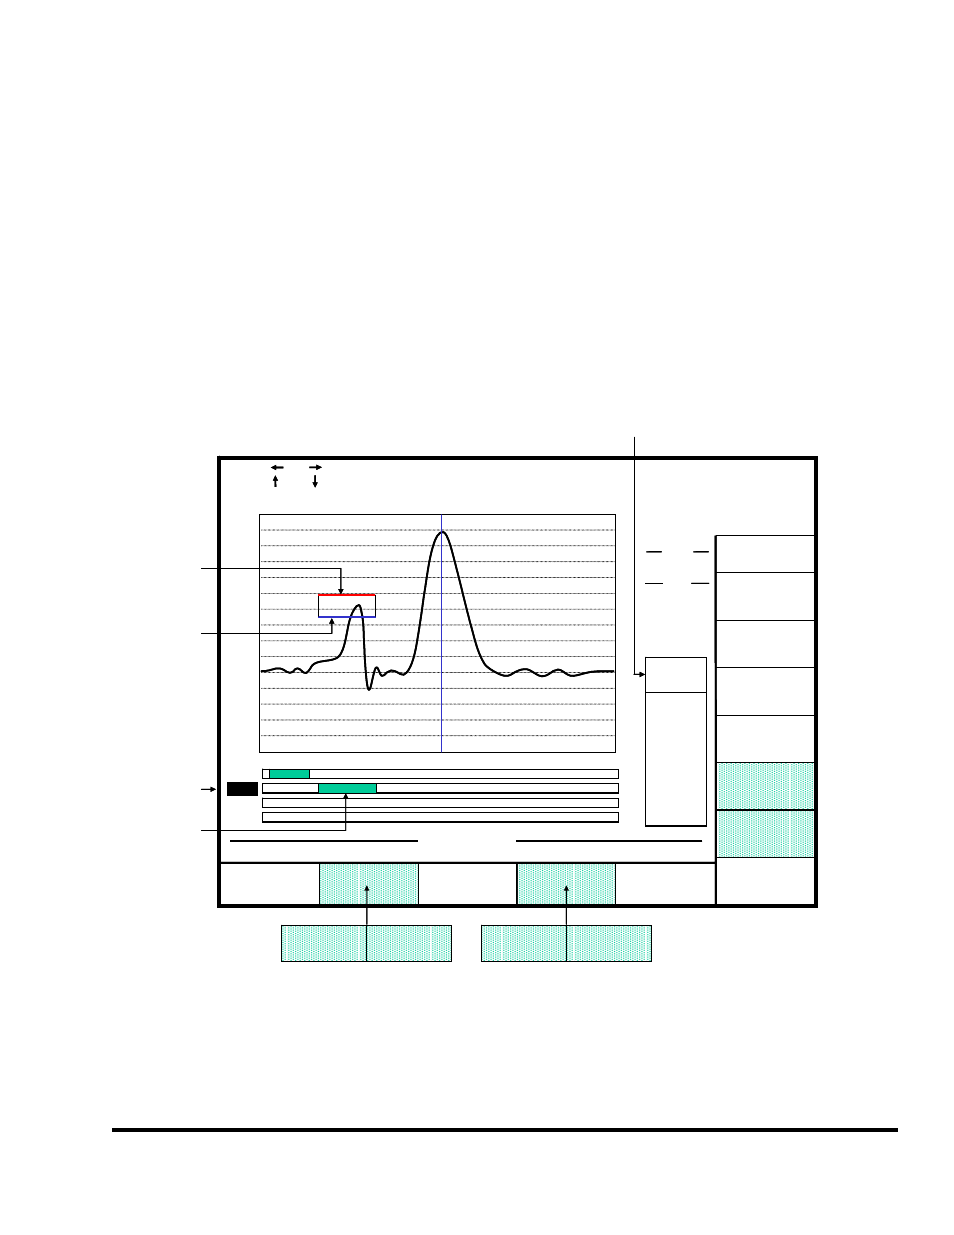
Figure 11 shows an example tonnage monitor graph screen when viewing a data window. For the most
part, the screen is the same as when viewing peak tonnages.
Channel 1
Tonnage
EXIT
NEXT
CHANNEL
SELECT
PEAK/DATA
WINDOW
Use the
and keys to move the graph cursor
Use the and keys to move the parameter cursor
OVERLAY
GRAPHS
Angle: 180.0°
Tonnage: 89.8 Tons
Cursor Readout
CHANNEL 1 TONS – DW 2 SETPOINTS
DW 1
DW 2
DW 3
DW 4
DW 2
INFO
Start
End
100.0
90.0
80.0
70.0
60.0
50.0
40.0
30.0
20.0
10.0
0.0
-10.0
-20.0
-30.0
-40.0
-50.0
160.0°
180.0°
200.0°
160°
200°
View Pts: 1085
ENTER PAN
ZOOM MODE
SEND
GRAPH
SHOW REF
GRAPH
HIDE REF
GRAPH
r
DECREASE
XXXXXXXXX
INCREASE
XXXXXXXXX
CHANGE
NUMBER
GRAPH
SETTINGS
SHOW BY
TIME
SHOW BY
ANGLE
Cap Pts: 3143
L
p
q
HI LIM
LO LIM
S. ANG
49.3
35.0
165.0°
E. ANG
173.0°
o
n
Channel 1
Tonnage
EXIT
NEXT
CHANNEL
SELECT
PEAK/DATA
WINDOW
Use the
and keys to move the graph cursor
Use the and keys to move the parameter cursor
OVERLAY
GRAPHS
Angle: 180.0°
Tonnage: 89.8 Tons
Cursor Readout
CHANNEL 1 TONS – DW 2 SETPOINTS
DW 1
DW 2
DW 3
DW 4
DW 2
INFO
Start
End
100.0
90.0
80.0
70.0
60.0
50.0
40.0
30.0
20.0
10.0
0.0
-10.0
-20.0
-30.0
-40.0
-50.0
160.0°
180.0°
200.0°
160°
200°
View Pts: 1085
ENTER PAN
ZOOM MODE
SEND
GRAPH
SHOW REF
GRAPH
r
Cap Pts: 3143
HIDE REF
GRAPH
DECREASE
XXXXXXXXX
INCREASE
XXXXXXXXX
CHANGE
NUMBER
GRAPH
SETTINGS
SHOW BY
TIME
SHOW BY
ANGLE
L
p
q
HI LIM
LO LIM
S. ANG
49.3
35.0
165.0°
E. ANG
173.0°
o
n
Figure 11: Example Waveform with Data Window 2 Settings Selected for View