5 the tonnage monitor graph screen – LINK Systems 5100-8 Tonnage & Analog Signal Monitor User Manual
Page 32
Doc
#:
L-802-1110 Page
30 Rev.
02
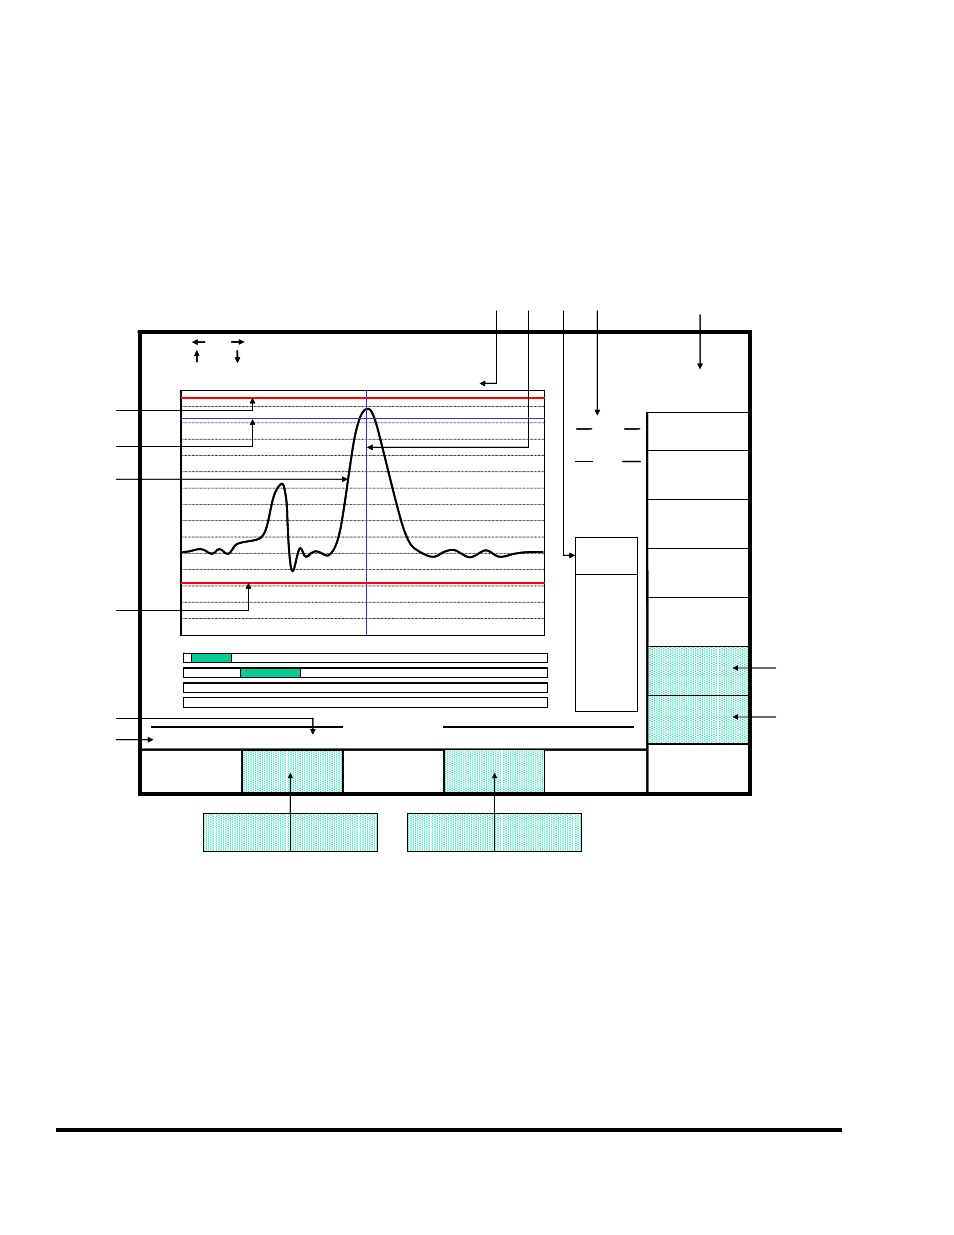
3.5 The Tonnage Monitor Graph Screen
The GRAPH softkey in the main tonnage monitor screen provides the operator or die setter more
detailed analysis of machine forces by displaying tonnage signatures.
Figure 10 shows an example screen viewing peak tonnage information, Figure 11 shows the same screen
when viewing “data window 2” information, and Figure 12 shows the screen when in Pan/Zoom mode.
Notice that the shaded softkeys in these figures change depending on the circumstances.
Channel 1
Tonnage
EXIT
NEXT
CHANNEL
SELECT
PEAK/DATA
WINDOW
Use the
and keys to move the graph cursor
Use the and keys to move the parameter cursor
OVERLAY
GRAPHS
Angle: 180.0°
Tonnage: 89.8 Tons
Cursor Readout
CHANNEL 1 TONS - PEAK SETPOINTS
DW 1
DW 2
DW 3
DW 4
PEAK
INFO
Start
End
100.0
90.0
80.0
70.0
60.0
50.0
40.0
30.0
20.0
10.0
0.0
-10.0
-20.0
-30.0
-40.0
-50.0
160.0°
180.0°
200.0°
160°
200°
View Pts: 1085
ENTER PAN
ZOOM MODE
SEND
GRAPH
SHOW REF
GRAPH
HIDE REF
GRAPH
HI LIM
LO LIM
RV LIM
In Figure 10, some of the features of the screen are:
a) Cursor Angle
The angle at which the vertical measuring cursor (at 180 degrees in Figure 10
and pointed to by “h”) is sitting.
b) Cursor Tonnage
The numeric value of tonnage where the vertical measuring cursor (at 180
degrees in Figure 10 and pointed to by “h”) crosses the tonnage waveform.
L
95.0
82.3
18.2
a
f
c
e
d
b
h
i
g
l
k
j
DECREASE
XXXXXXXXX
INCREASE
XXXXXXXXX
m
CHANGE
NUMBER
GRAPH
SETTINGS
SHOW BY
TIME
SHOW BY
ANGLE
Cap Pts: 3143
Channel 1
Tonnage
EXIT
NEXT
CHANNEL
SELECT
PEAK/DATA
WINDOW
Use the
and keys to move the graph cursor
Use the and keys to move the parameter cursor
OVERLAY
GRAPHS
Angle: 180.0°
Tonnage: 89.8 Tons
Cursor Readout
CHANNEL 1 TONS - PEAK SETPOINTS
DW 1
DW 2
DW 3
DW 4
PEAK
INFO
Start
End
100.0
90.0
80.0
70.0
60.0
50.0
40.0
30.0
20.0
10.0
0.0
-10.0
-20.0
-30.0
-40.0
-50.0
160.0°
180.0°
200.0°
160°
200°
View Pts: 1085
ENTER PAN
ZOOM MODE
SEND
GRAPH
SHOW REF
GRAPH
HIDE REF
GRAPH
HI LIM
LO LIM
RV LIM
L
95.0
82.3
18.2
a
f
c
e
d
b
h
i
g
l
k
j
Cap Pts: 3143
DECREASE
XXXXXXXXX
INCREASE
XXXXXXXXX
m
CHANGE
NUMBER
GRAPH
SETTINGS
SHOW BY
TIME
SHOW BY
ANGLE
Figure 10: Example Tonnage Waveform with Peak Settings Selected for View