Ecow, 1 introduction, 2 glossary – YSI 600LS - User Manual User Manual
Page 197
EcoWatch for Windows
Section 4
YSI Incorporated
Environmental Monitoring Systems Manual
4-1
SECTION 4 ECOWATCH FOR WINDOWS
4.1
INTRODUCTION
EcoWatch for Windows is intended to be the PC software interface to YSI’s 6-Series environmental
monitoring systems equipment. From EcoWatch you can program field equipment, upload data collected
on the equipment, and format the data in easy to understand graphs and tables.
4.1.2
GLOSSARY
These are a few of the more commonly used terms used in EcoWatch.
Term
Definition
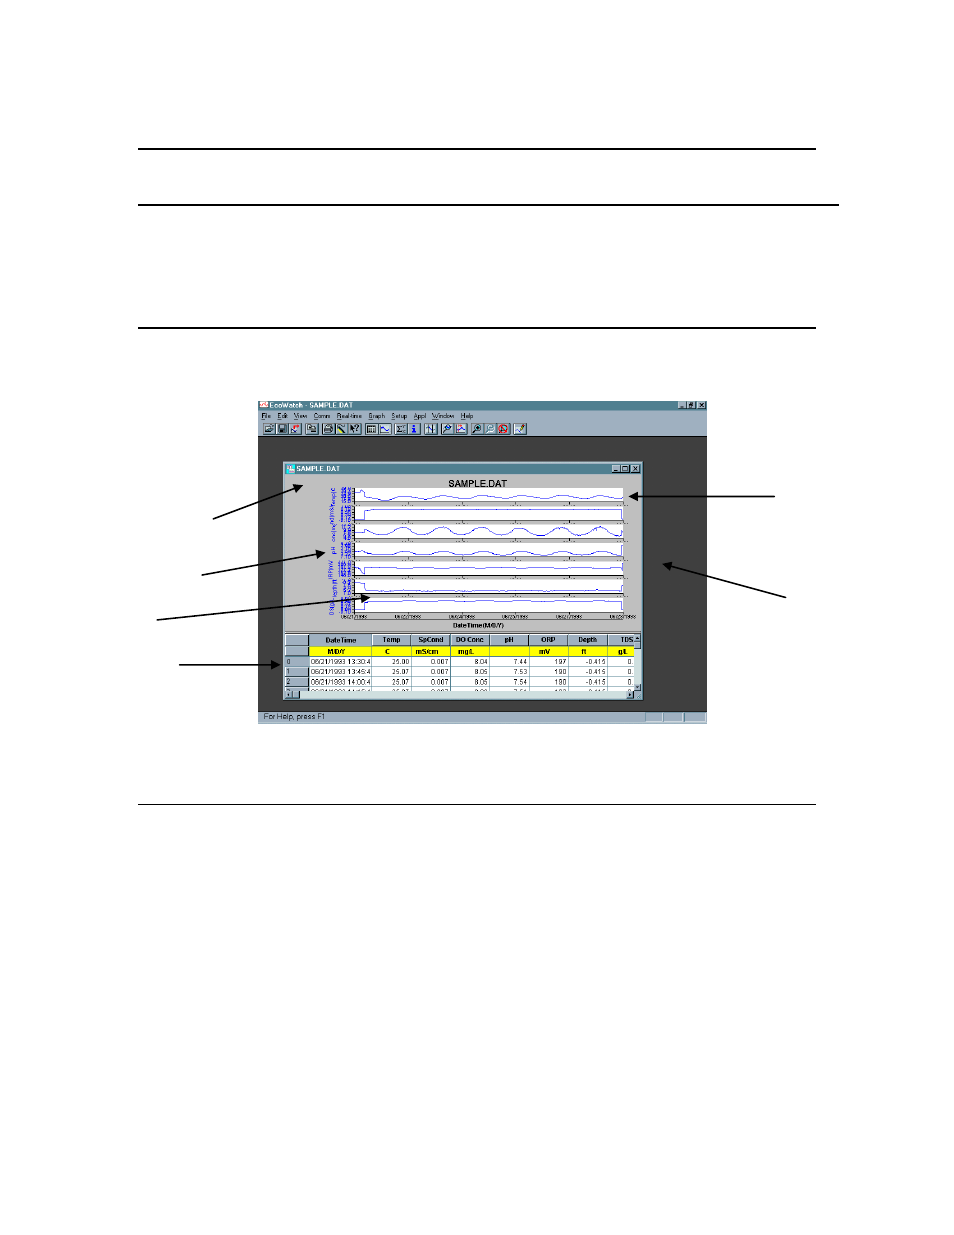
1 - Data display window
The window that appears when you open a .DAT file.
2 - Parameter
A measurement such as temperature, dissolved oxygen, pH,
etc. On a graph, the data of a parameter is displayed as a
trace.
3 - Trace
The plot of the data of any one parameter. There may be one
or two traces per graph.
4 - Graph
There may be one or more graphs depending upon how many
parameters are selected. Each graph may have one or two
traces. Data can be displayed either in graphs or in a table, or
both.
5 - Table
Numbers arranged in rows and columns. Data can be
displayed either in graphs or in a table, or both.
5 - Table
6 - Page
3 -
Trace
2 - Parameter
1 - Data Display Window
4 - Graph