Casio fx-9860G SD User Manual
Page 350
20050401
u
u
u
u
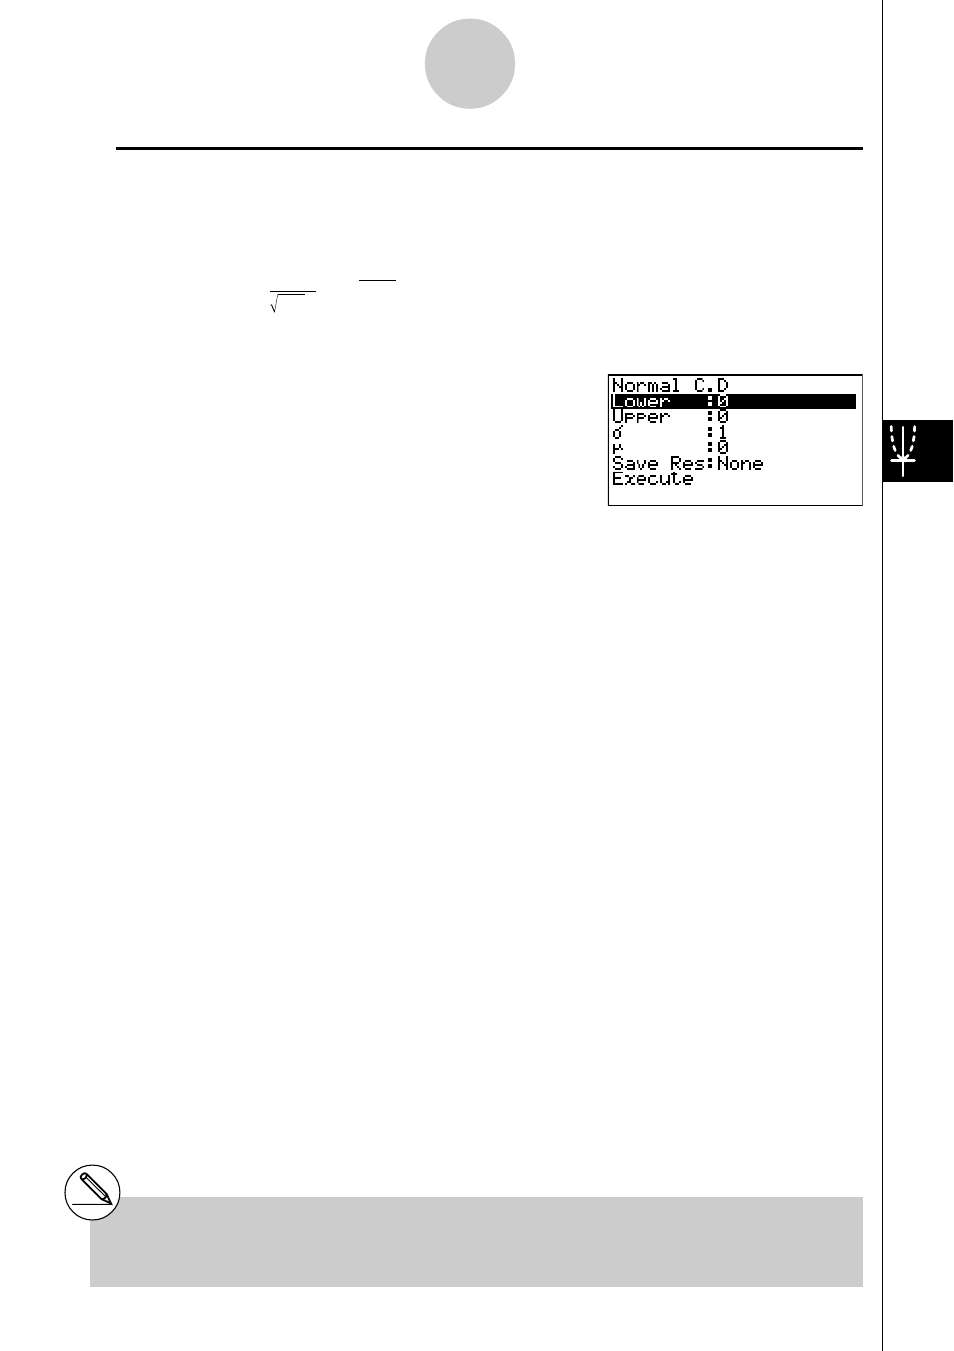
u Normal Distribution Probability
Normal distribution probability calculates the probability of normal distribution data falling
between two specific values.
πσ
2
p
=
1
e
–
dx
2
2
σ
(x –
µ
)
2
µ
a
b
∫
a
: lower boundary
b
: upper boundary
Perform the following key operations from the statistical data list.
5(DIST)
1(NORM)
2(Ncd)
Data is specified using parameter specification. The following shows the meaning of each
item.
Lower .......................... lower boundary
Upper .......................... upper boundary
σ .................................. standard deviation (σ
> 0)
µ .................................. mean
Save Res .................... list for storage of calculation results (None or List 1 to 26)
Execute ....................... executes a calculation
After setting all the parameters, use
c to move the highlighting to “Execute” and then press
the function key shown below to perform the calculation.
• 1(CALC) ... Performs the calculation.
# There is no graphing for normal distribution
probability.
6-7-4
Distribution