Casio fx-9860G SD User Manual
Page 265
20050401
○ ○ ○ ○ ○
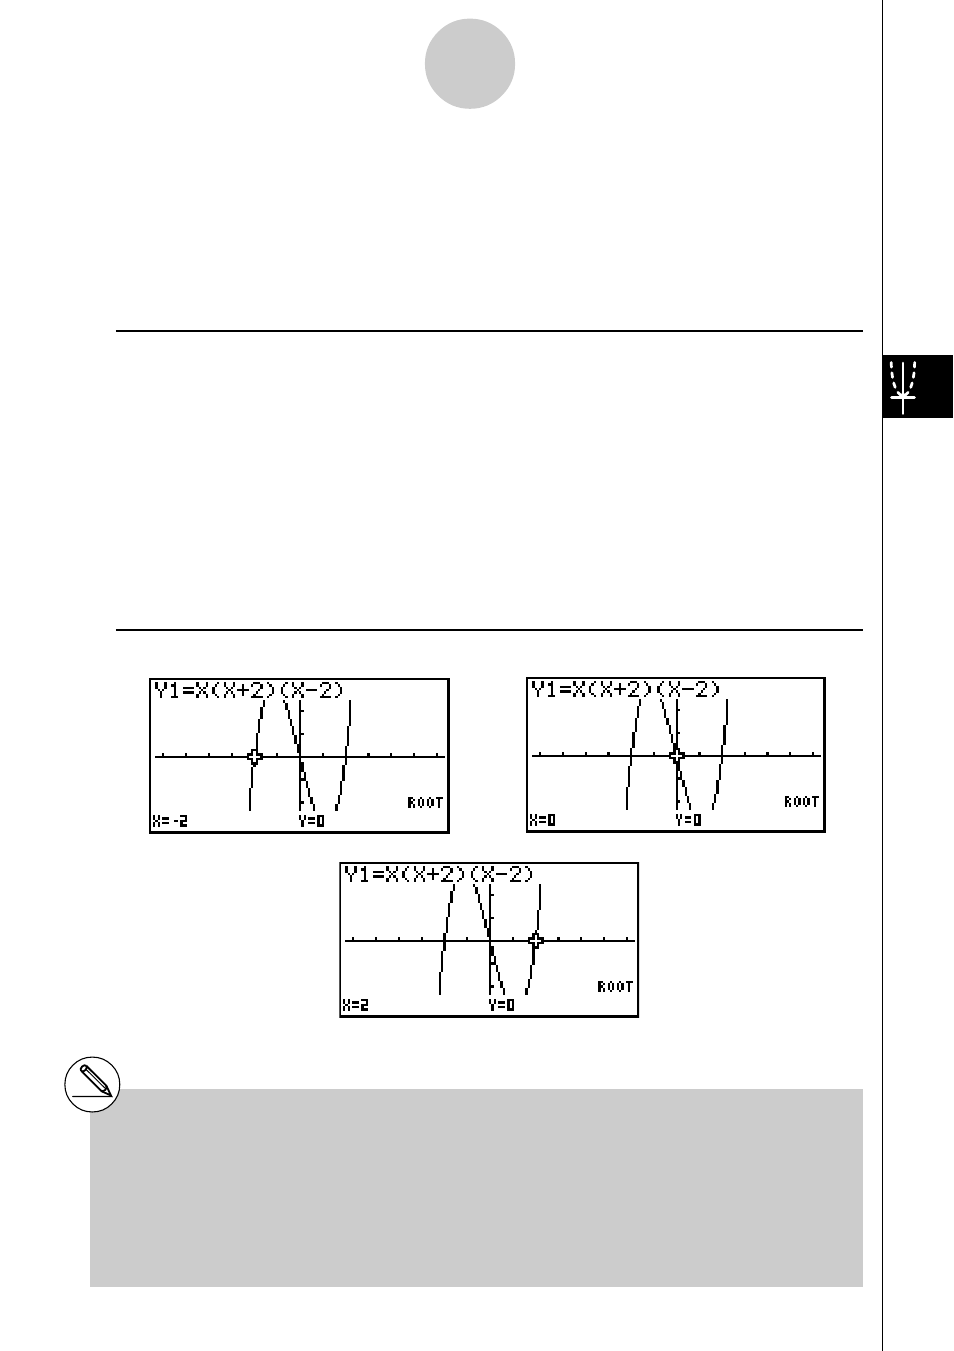
Example
Draw the graph shown below and calculate the root for Y1.
Y1 =
x
(
x
+ 2)(
x
– 2)
Use the following V-Window settings.
Xmin = –6.3, Xmax = 6.3, Xscale = 1
Ymin = –3.1, Ymax = 3.1, Yscale = 1 (initial defaults)
Procedure
1
m GRAPH
2
!3(V-WIN)1(INIT)J
3(TYPE)1(Y=)v(v+c)(v-c)w
6(DRAW)
3
!5(G-SLV)1(ROOT)
5 e
e
Result Screen
5-11-10
Function Analysis
# When analyzing a single graph, results appear
as soon as you select an analysis function in
step 3, so step 4 is not necessary.
# Root, local maximum value, local minimum
value, and
y
-intercept can be calculated for
rectangular coordinate graphs and inequality
graphs only.
# Graph analysis is not possible for the graph
whose function is the format X = constant.
# The
y
-intercept is the point where the graph
crosses the
y
-axis.
…