K logarithmic regression graph, K exponential regression graph – Casio fx-9860G SD User Manual
Page 294
20050401
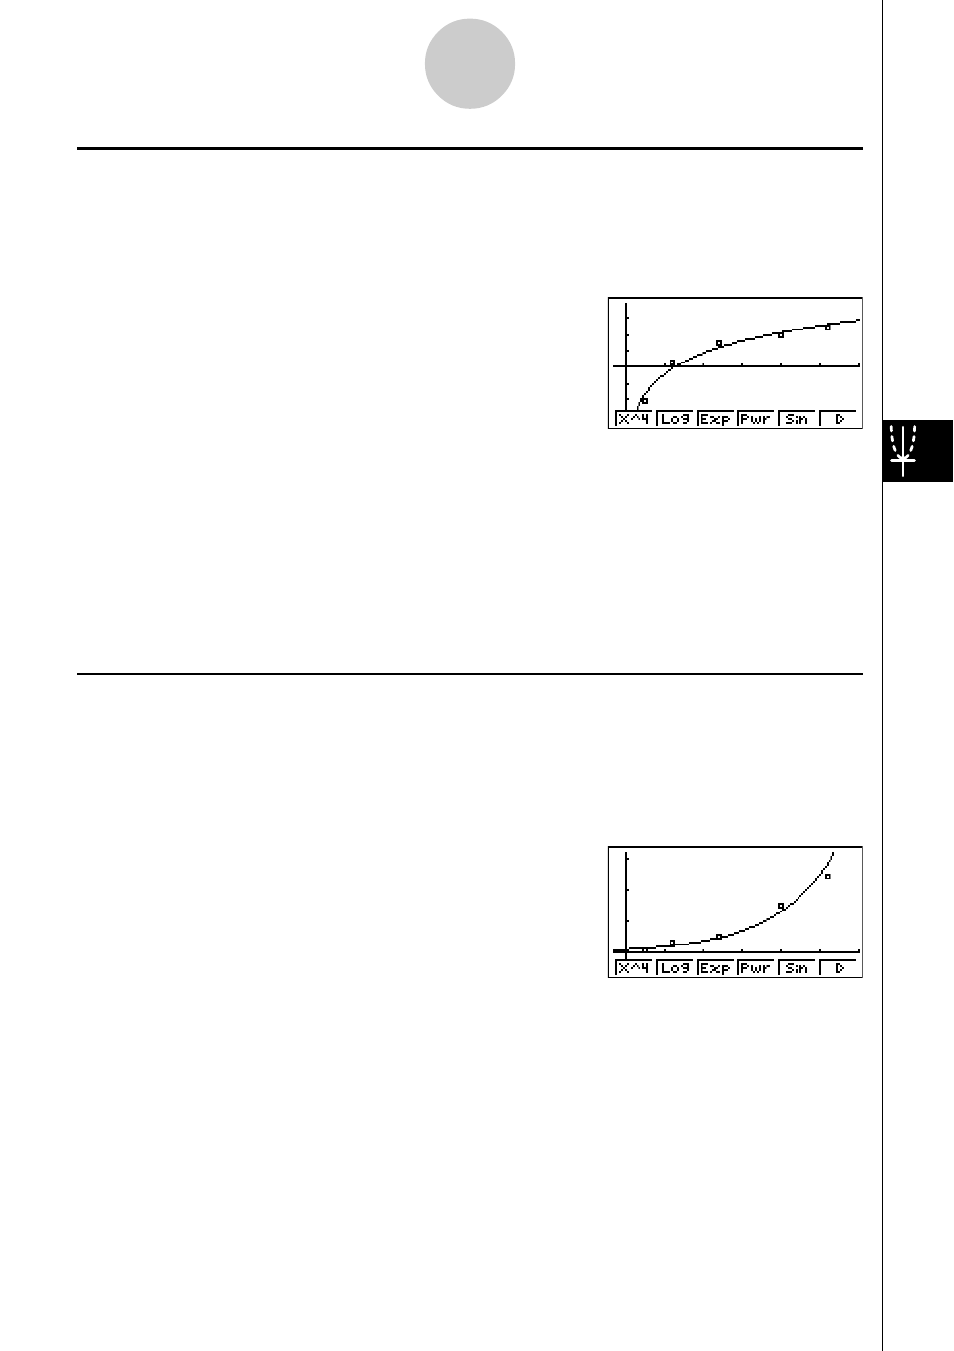
k Logarithmic Regression Graph
Logarithmic regression expresses
y
as a logarithmic function of
x
. The standard logarithmic
regression formula is
y
=
a
+
b
× In
x
, so if we say that X = In
x
, the formula corresponds to
linear regression formula
y
=
a
+
b
X.
1(CALC)6(g)2(Log)
6(DRAW)
The following is the logarithmic regression model formula.
y
=
a
+
b
•
ln
x
a .............
regression constant term
b .............
regression coefficient
r ..............
correlation coefficient
r
2
............ coefficient of determination
MSe
........ mean square error
k Exponential Regression Graph
Exponential regression expresses
y
as a proportion of the exponential function of
x
. The
standard exponential regression formula is
y
=
a
×
e
bx
, so if we take the logarithms of both
sides we get In
y
= In
a
+
bx
. Next, if we say Y = In
y
, and A = In
a
, the formula corresponds
to linear regression formula Y = A +
bx
.
1(CALC)6(g)3(Exp)
6(DRAW)
The following is the exponential regression model formula.
y
=
a
•
e
bx
a .............
regression coefficient
b .............
regression constant term
r ..............
correlation coefficient
r
2
............ coefficient of determination
MSe
........ mean square error
6-3-8
Calculating and Graphing Paired-Variable Statistical Data