K normal probability distribution calculation – Casio fx-9860G SD User Manual
Page 307
20050401
k Normal Probability Distribution Calculation
You can calculate normal probability distributions for single-variable statistics with the
RUN
•
MAT mode.
Press K6(
g)3(PROB)6(g) to display a function menu, which contains the following
items.
• {P(}/{Q(}/{R(} ... obtains normal probability {P(
t
)}/{Q(
t
)}/{R(
t
)} value
• {
t
(} ... {obtains normalized variate
t
(
x
) value}
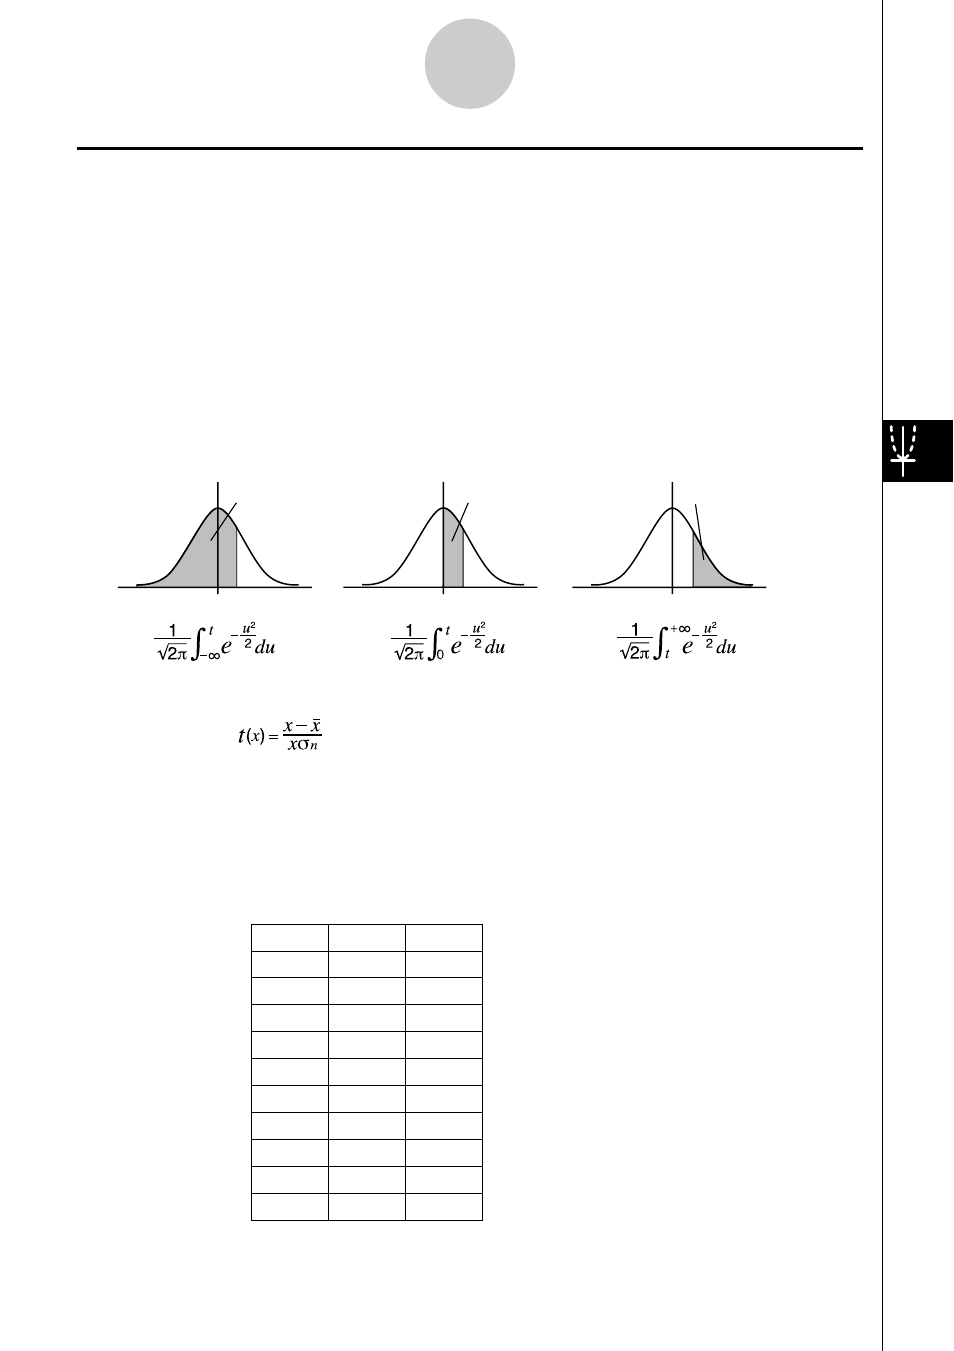
• Normal probability P(
t
), Q(
t
), and R(
t
), and normalized variate
t
(
x
) are calculated using
the following formulas.
Standard Normal Distribution
P (
t
)
Q (
t
)
R (
t
)
t
t
t
0
0
0
○ ○ ○ ○ ○
Example
The following table shows the results of measurements of the height
of 20 college students. Determine what percentage of the students fall
in the range 160.5 cm to 175.5 cm. Also, in what percentile does the
175.5 cm tall student fall?
Class no.
Height (cm)
Frequency
1
158.5
1
2
160.5
1
3
163.3
2
4
167.5
2
5
170.2
3
6
173.3
4
7
175.5
2
8
178.6
2
9
180.4
2
10
186.7
1
6-4-7
Performing Statistical Calculations