Casio fx-9860G SD User Manual
Page 300
20050401
○ ○ ○ ○ ○
Example
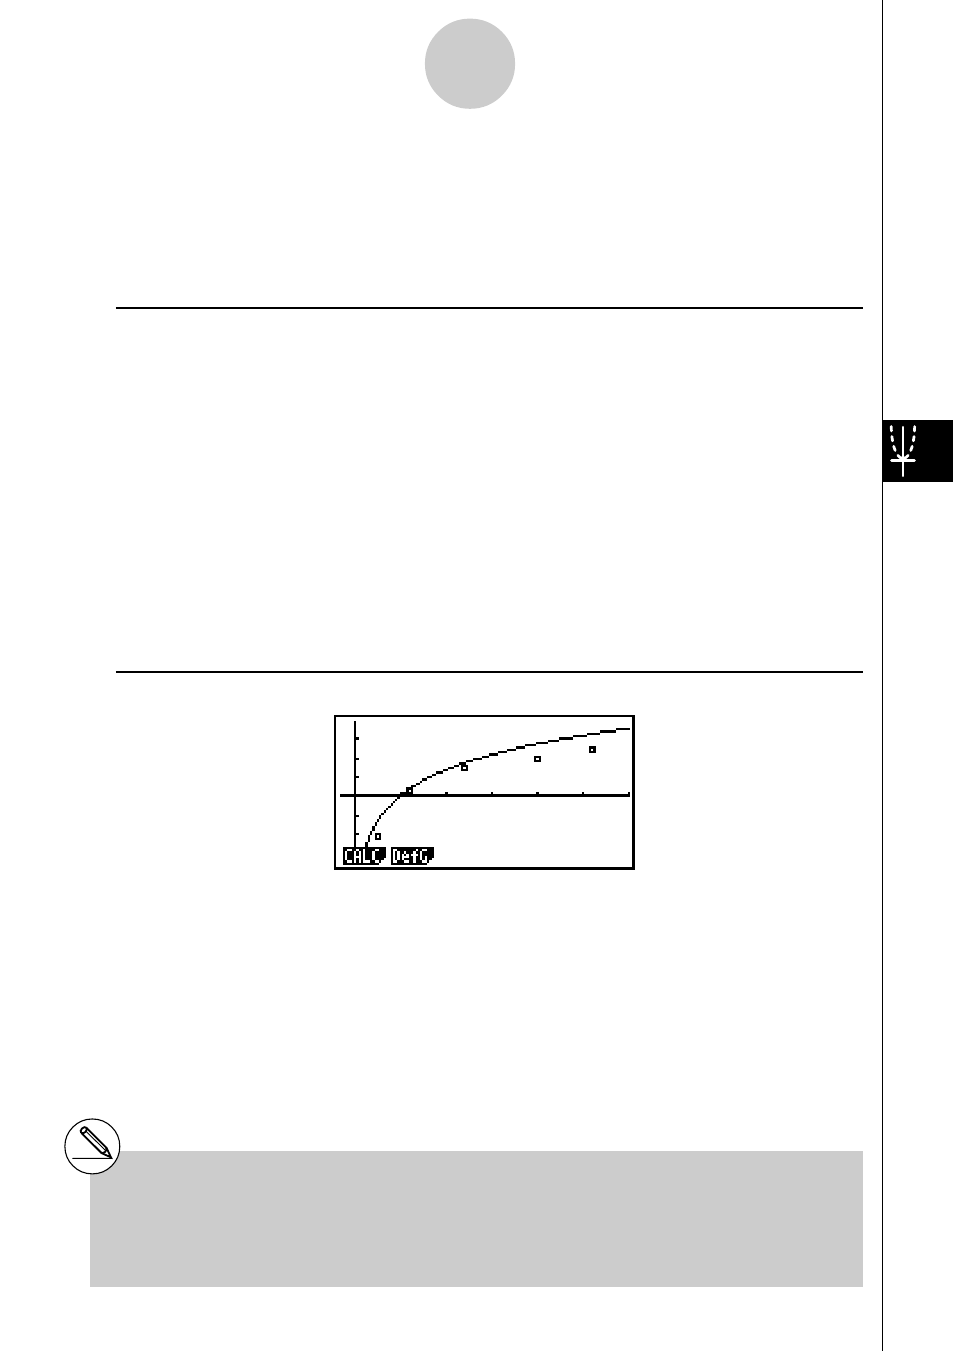
Input the two sets of data shown below. Next, plot the data on a
scatter diagram and overlay a function graph
y
= 2ln
x
.
0.5, 1.2, 2.4, 4.0, 5.2
–2.1, 0.3, 1.5, 2.0, 2.4
Procedure
1
m STAT
2 a.f
wb.cw
c.e
wewf.cw
e
-c.bwa.dw
b.f
wcwc.ew
1(GRPH)1(GPH1)
3
2(DefG)
c
Ivw(Register Y1 = 2In x)
4
6(DRAW)
Result Screen
6-3-14
Calculating and Graphing Paired-Variable Statistical Data
# You can also perform trace, etc. for drawn
function graphs.
# Graphs of types other than rectangular
coordinate graphs cannot be drawn.
# Pressing J while inputting a function returns
the expression to what it was prior to input.
Pressing !J(QUIT) clears the input
expression and returns to the statistical data list.
This manual is related to the following products: