20050401
5-6-2
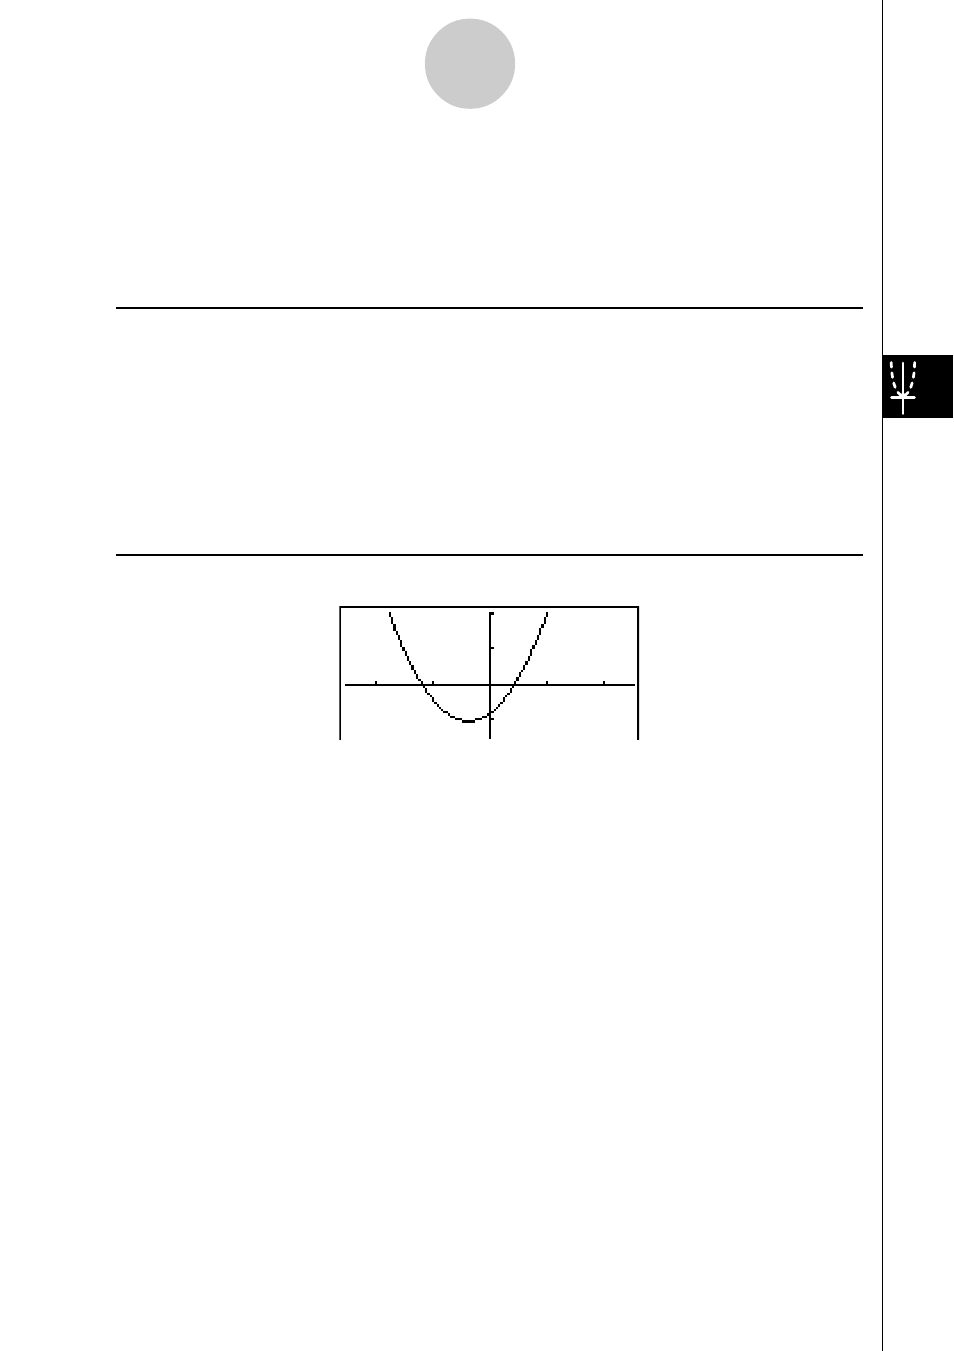
Manual Graphing
○ ○ ○ ○ ○
Example
Graph
y
= 2
x
2
+ 3
x
– 4
Use the following V-Window settings.
Xmin = –5,
Xmax = 5,
Xscale = 2
Ymin = –10,
Ymax = 10,
Yscale = 5
Procedure
1
m RUN
•
MAT
2
!3(V-WIN) -fwfwcwc
-bawbawfwJ
3
!4(SKTCH)1(Cls)w
5(GRPH)1(Y=)
4 c
vx+dv-ew
Result Screen