Juniper Systems LandMark Mobile User Manual
Page 25
LandMark Mobile User’s Manual 25
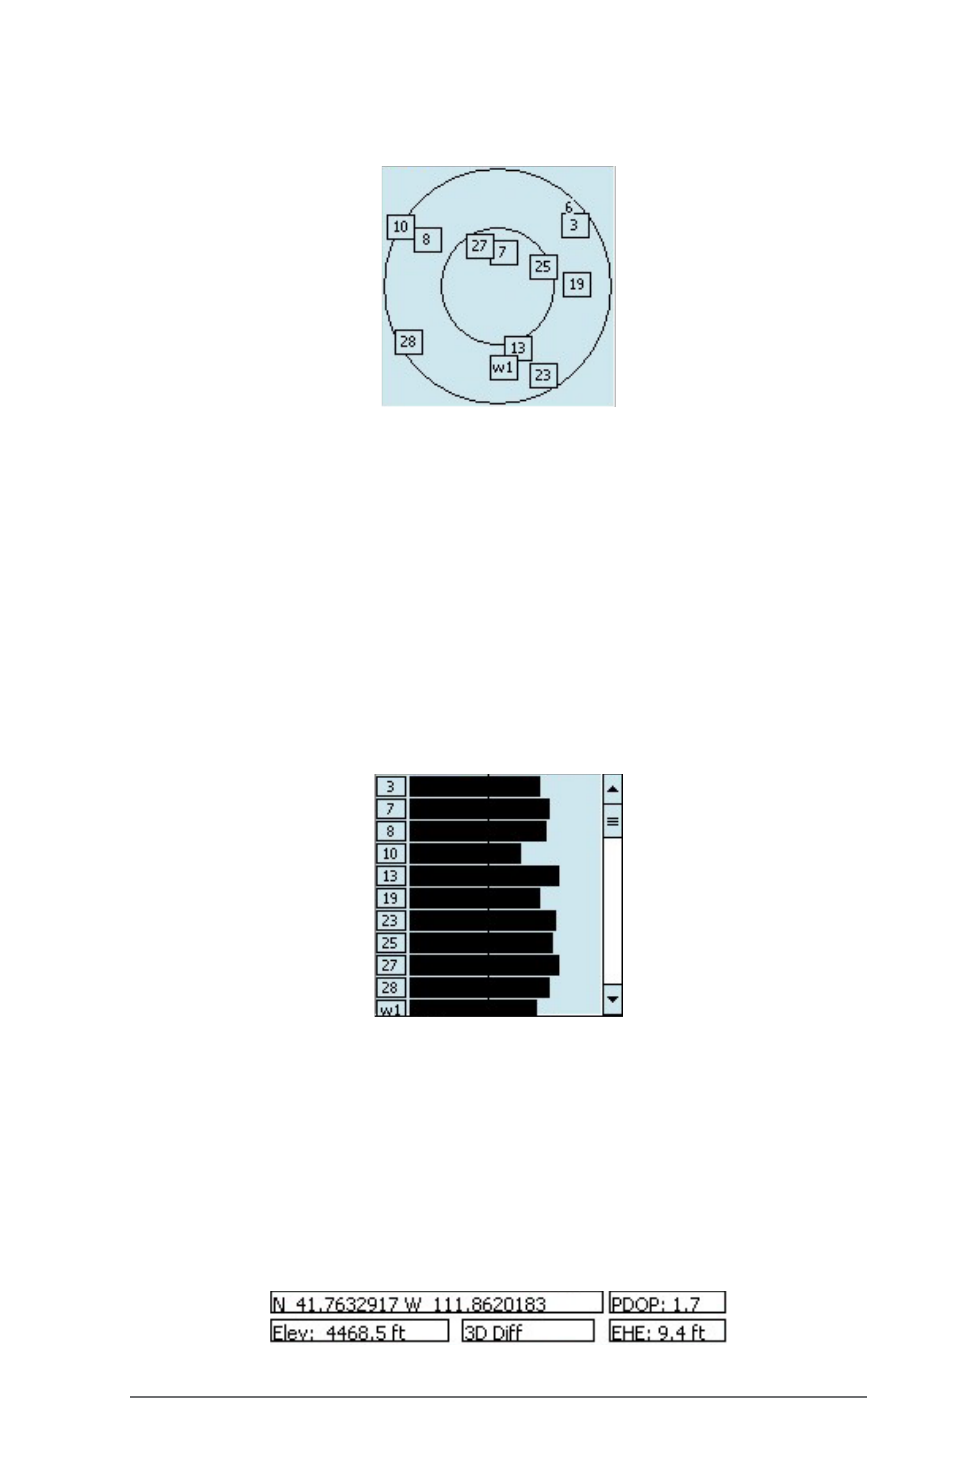
inner circle represents the area above you, this circle has a 60
degree incline from the outer circle.
When a satellite rises above the horizon, the GPS receiver can then
receive a positioning signal from the satellite. The satellite then
appears in the skyplot section of the GPS screen. GPS readings are
more accurate when the satellites are more scattered across the sky.
The right side of the GPS status screen displays a bar graph
showing the relative satellite signal strengths. Each satellite
is assigned an SV number (space vehicle or satellite vehicle
number). These numbers appear to the left of their corresponding
signal strength bars. A boxed number indicates which particular
satellite is being used to determine the GPS position.
Note: Only active satellites are displayed on the bar graph, but all
viewable satellites are displayed in the Skyplot. The scroll bar on the
right of the graph box allows you to view all displayed satellites.
Latitude, longitude, elevation, and position quality values are
shown below the skyplot section of the GPS screen. The PDOP
(Position Dilution of Precision) and EHE (Estimated Horizontal
position Error) values are shown under the bar graphs.