Setup-plot, More examples – HP 38g Graphing Calculator User Manual
Page 92
Attention! The text in this document has been recognized automatically. To view the original document, you can use the "Original mode".
More Examples
Function
Example
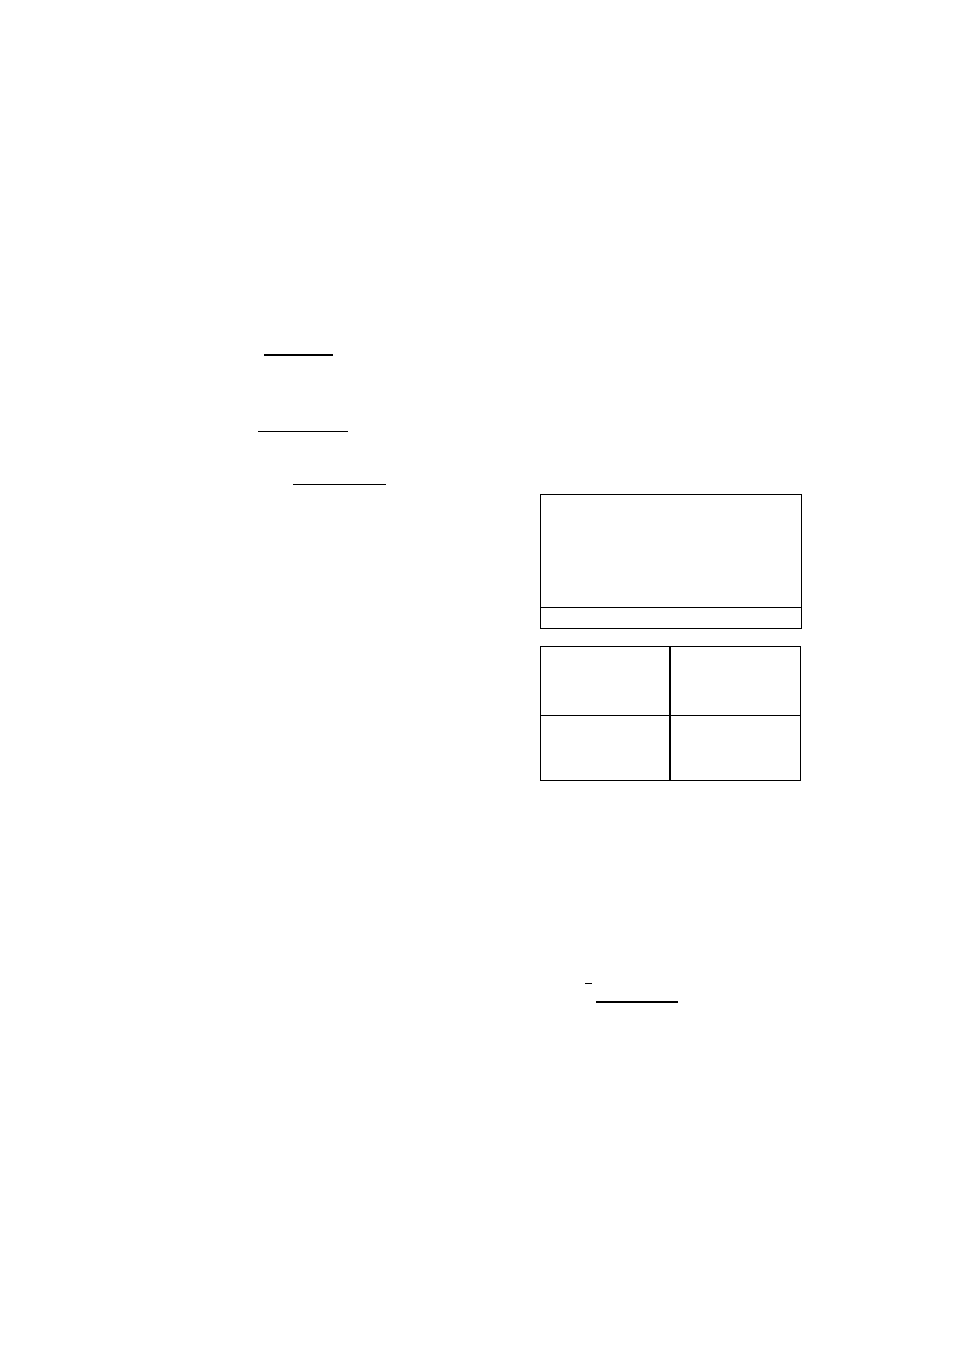
Plot the circle, = 13. Rearrange the equation to
y =
.
This must be entered as two expressions,
y = ^(l3-x') and y =
.
I
LIB
I
Se/ect
Function
SYMB
[^[D 13 □
{{X}}
[x3 2Q]
I
ENTER
I
EU [S 0 13 □ {{X}} [13
2Q] I
ENTER
I
■ [SETUP-PLOT]
(Check that the Plot settings
are the defaults—if not, press
■ [CLEAR] .J
PLOT
IFUNCTIDN SVMeaUC MIEH
<^Fl
>/F2CX>=-Ta3-X''2>
F4CX>=
F5
w
FUNCTION PLOT SETUP
KRNG:
■ 6.5
VRNG: -3. 1
3.2
¡¡TICK: 1
VTICK: 1
RES:
Faster
ENTER MINIMUM HURIZDNTRL VALUE
\
H: 0 FiiX
/
): 3.S0SSS1 li!M!ll|
The calculator plots the two expressions of the conic plot
separately, sometimes producing a discontinuity in the graph.
Specify a finer resolution to minimize these discontinuities.
(The gaps are due to the sampling interval.)
■ [SETUP-PLOT]
ESS {{cHoos}}
Select
Mor&
Detail
FUNCTIPN FLOT SETUP
!if!NG" ”6« 5
6*5
VRNa: -3.1
3.2
KTICK: 1
VTICK: 1
RES: legUCTM
CHUaSE PLOT RESULUTIDN
3-28 Plotting and Exploring Functions