Using a table of numbers, Display a table of numbers (numeric view), Using a table of numbers -23 – HP 38g Graphing Calculator User Manual
Page 87: Display a table of numbers (numeric view) -23
Attention! The text in this document has been recognized automatically. To view the original document, you can use the "Original mode".
Using a Table of Numbers
Display a Table of Numbers (Numeric View)
After entering and selecting (checkmarking) the expression
in the Symbolic view, press |
num
|
to view a table of data
values for the independent (X, T, 0, or N) and dependent
variables. To adjust the initial value or step size, change the
Numeric Setup.
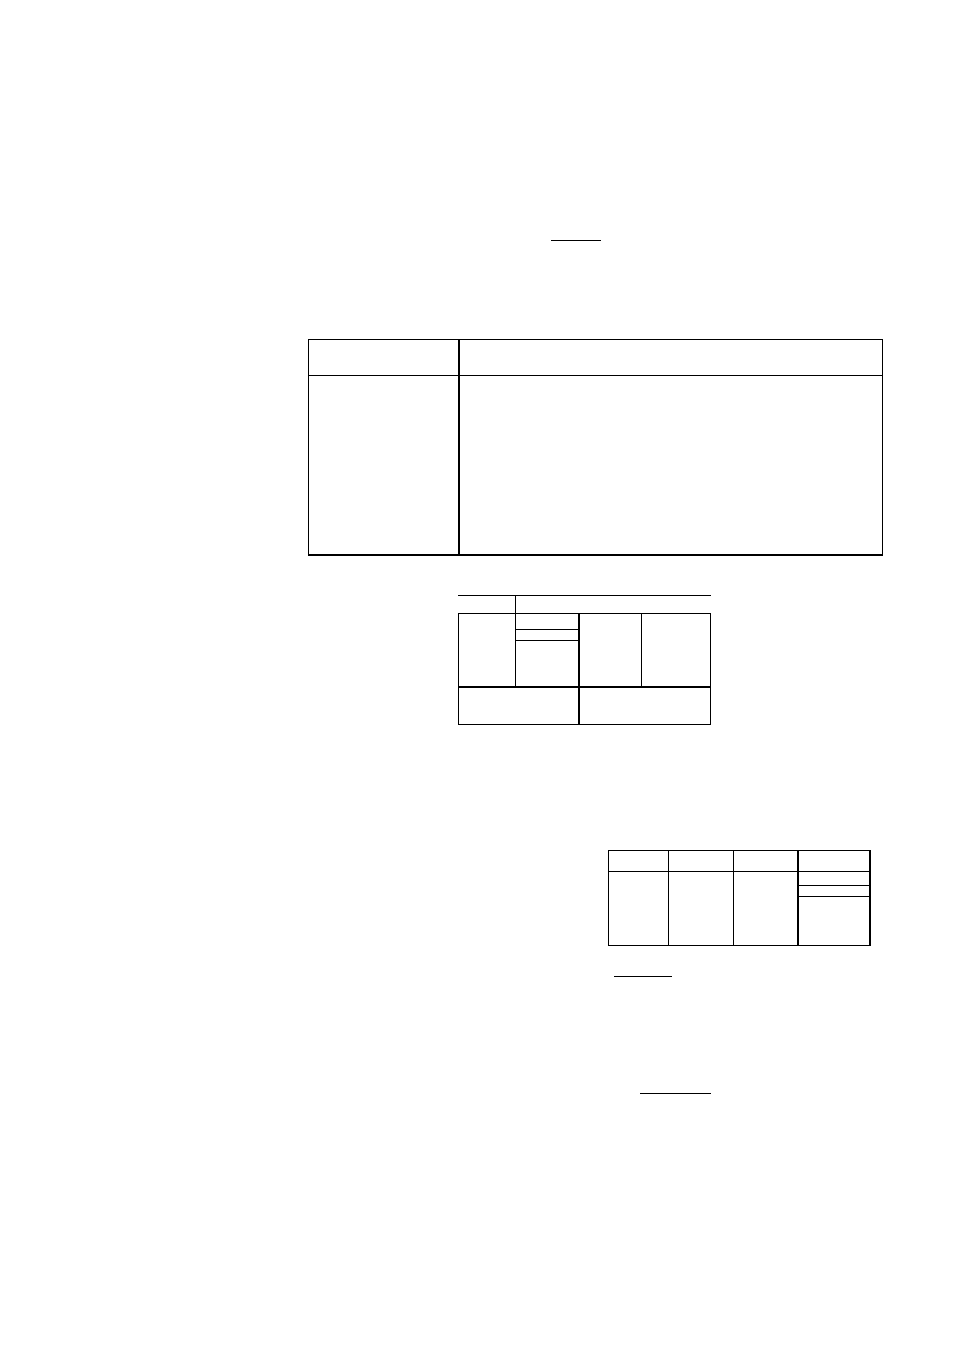
NUM View
Keys
Key
Meaning
{{ZOOM}}
{{BIG}}
{{DEFN}}
Displays ZOOM menu list.
Toggles between two character sizes.
Displays the
defining
function expression for
the highlighted column. To cancel this
display, press
{{DEF
b
}}.
independent
variable
full display of
highlighted -
value
-
X
F3
---------------------------------
tf
.1
.S
.3
.4
.5
(f
.3435303
.ЗВ4Ч1ВЭ
.4744355
9.98334166-:
М||||81ИНМ1—1
t68E-2
laatriaragran—
' dependent
variable
The table adds columns for each additional expression that is
checkmarked in the Symbolic view.
Press
{{DEFN}}
to display the
expression that defines the
function in the highlighted
column.
S I N C X : )
Hililgl—
X
FI
F2
F3
0
.1
.3
.3
.4
.5
-1
-.44
-.46
-.41
-.ВЧ
-.75
.001
.008
.037
.064
.135
A
ВЕЕПЕЕП
ТоткчУ
.3455303
.ЭВ441ВЗ
.4744355
Automatic You can enter any new value in the X column for the
Recalculation independent variable. When you then press |
enter
!
. the
values for the dependent variables are recalculated, and the
entire table is regenerated with a new interval between X
values.
Plotting and Exploring Functions 3-23