Symb – HP 38g Graphing Calculator User Manual
Page 110
Attention! The text in this document has been recognized automatically. To view the original document, you can use the "Original mode".
Find the mean advertising time (MEANX), the mean sales
(MEANY), and the correlation coefficient (CORK) for the data
fitting a straight line. The CORK value indicates how well the
linear model fits the data.
rNDKTI {{STATS}}
Displays computed statistics.
MEANX is about 3.3 minutes
and MEANY is about $1796.
Scroll down to display CORE.
CORE is 0.8995 to four
significant digits.
{{OK}}
■ {SETUP-PLOT] 00
{{CHOOS}} 0 {{OK}}
This makes the mark for SI
more visible.
m
[VIEWS]
Select
Auto Scale {{OK}}
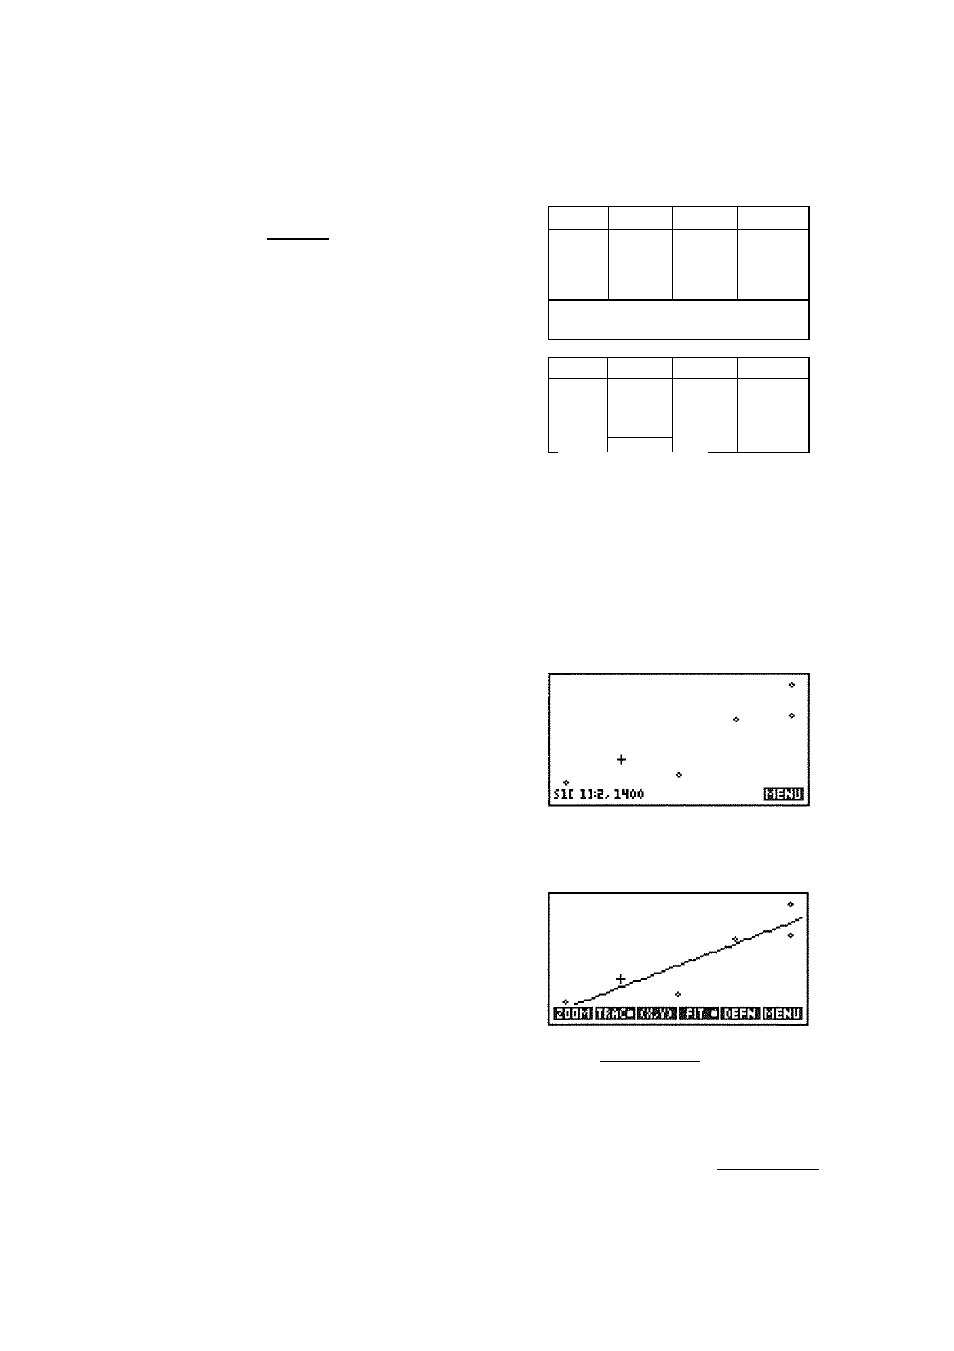
(//■{{FIT«}}
is on, the
regression line also appears.)
a-vflftSI
MEANS
IK
IKS
MEflNV
lY
lYE
rpim
BO
17B5.B33
10775
iE53B7S5
3.33333333333
E-VflR
SI
IKE
MEflNV
IV
IVE
IKV
CDRR
BO
17<15.B33
10775
EE33B7ES
NlSqS
,899530938561
STATISTICS FLDT SETUP
KRN6:
-2
24
VRNG:
-2
10.6
SIMAR&H SeMARK; * S3HARK!
4.
SHMARK:;; SBMARKiK
CHOUSE MARK FDR SCATTER PLOT
To find the regression curve (a curve to fit the data points)
and regression values, set
{{FIT«}}
on, if it is not already.
{{MENU}} {{FIT}}
This draws the regression line
for the best linear fit
SYMB
Values for m and b are
substituted into the regression
expression for the Fitl field.
STATISTICS SVMROLIC VIEW
C2
V' F i 11: 425.875»X+376.„
S2:
Fit2:n*X+b
¥
ENTER INDEPENDENT
iHiiiiBiranEi
5-4 Statistics