Setting up the plot (plot setup), Setting up the plot (plot setup) -18 – HP 38g Graphing Calculator User Manual
Page 82
Attention! The text in this document has been recognized automatically. To view the original document, you can use the "Original mode".
Setting Up the Plot (Plot Setup)
Press ■ [SETUP-PLOT] to define any of the settings shown in
the next two tables.
1. Use the arrow keys to move from field to field. Highlight
the field to edit.
• If there is a number to enter, type it in and press |
enter
|
or {{OK}}.
•
If there is an option to choose, press {{CHOOS}},
highlight your choice, and press |
enter
| or
{{
ok
}}.
A
s
a
shortcut to {{CHOOS}}, just highlight the field to change
and press to display and select the different
choices.
• If there is an option to turn on/off, press {{/CHK}} to
check or uncheck it.
2. Press {{PAGET}} to view more settings.
3. When done, press
[
plot
]
to view the new plot.
To reset
settings
{SETUP-PLOT}
Settings
To reset the default values for all plot settings, press
■ {CLEAR} in the Plot Setup view.
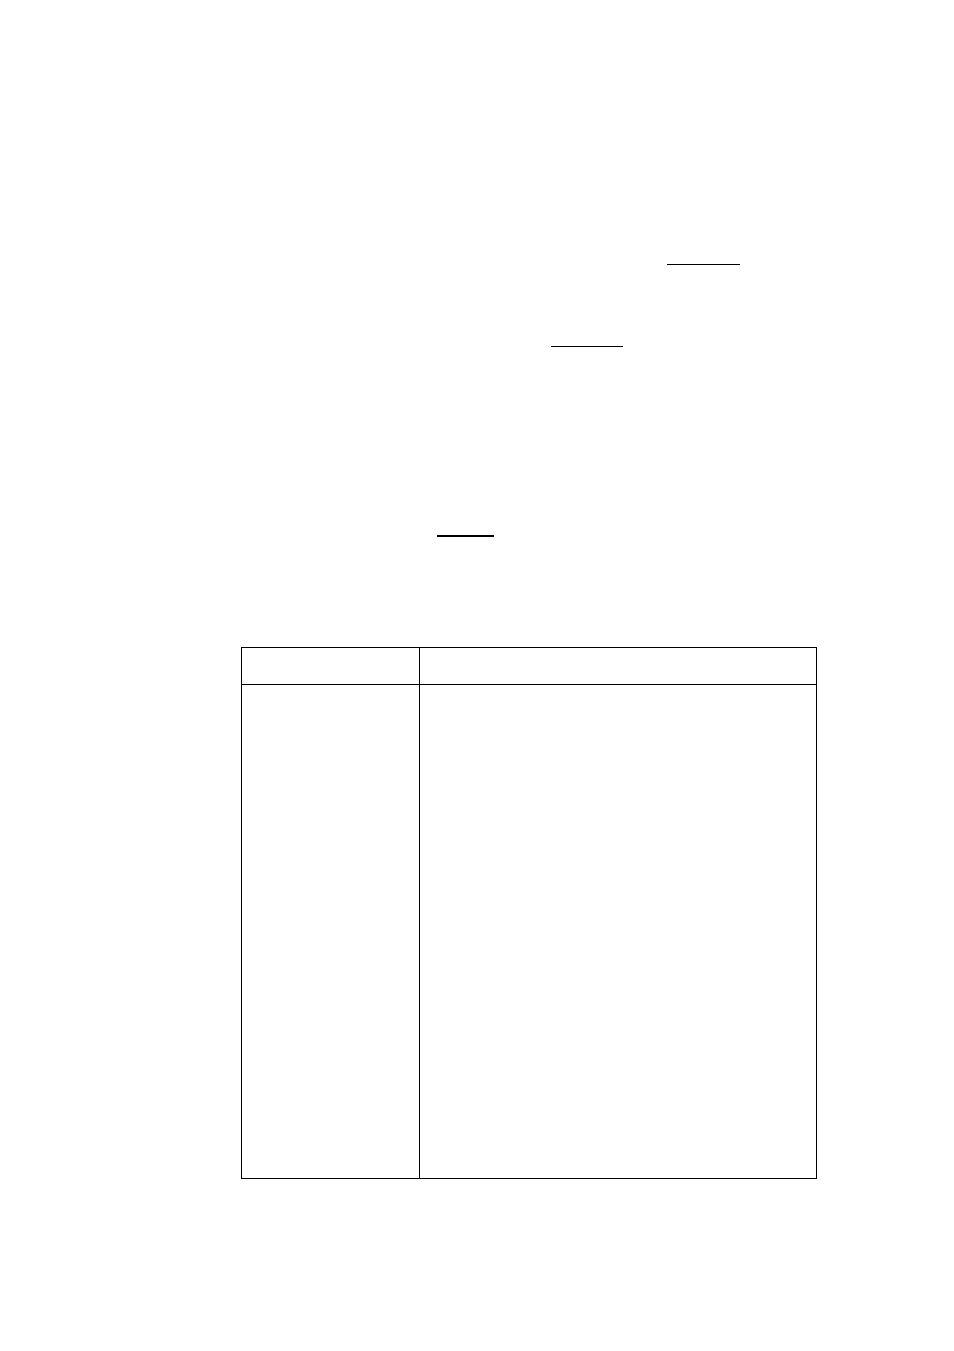
Field
Meaning
XRNG, Y R N G .
T R N G ,
6
RNG,
NRNG
For Function plot: Specifies the
minimum and maximum horizontal (X)
and vertical (Y) values for the plotting
window.
For Parametric, Polar, and Sequence
plots: Specifies the time (T), angle (0), or
index (N) values for the graph.
RES
For Function plots: Resolution. "Faster"
plots in alternate pixel columns; "More
Detail" plots in every pixel column.
TSTEP , eSTEP
For Parametric and Polar plots:
intervals at which to use the independent
variable to calculate the function.
SEQPLOT
For Sequence plots: Stairstep or
Cobweb types.
XTICK
Horizontal spacing for tickmarks.
YTICK
Vertical spacing for tickmarks.
3-18 Plotting and Exploring Functions