Zooming, Examples: plotting, Setup-plot – HP 38g Graphing Calculator User Manual
Page 72: Examples: plotting -8
Attention! The text in this document has been recognized automatically. To view the original document, you can use the "Original mode".
Undefined
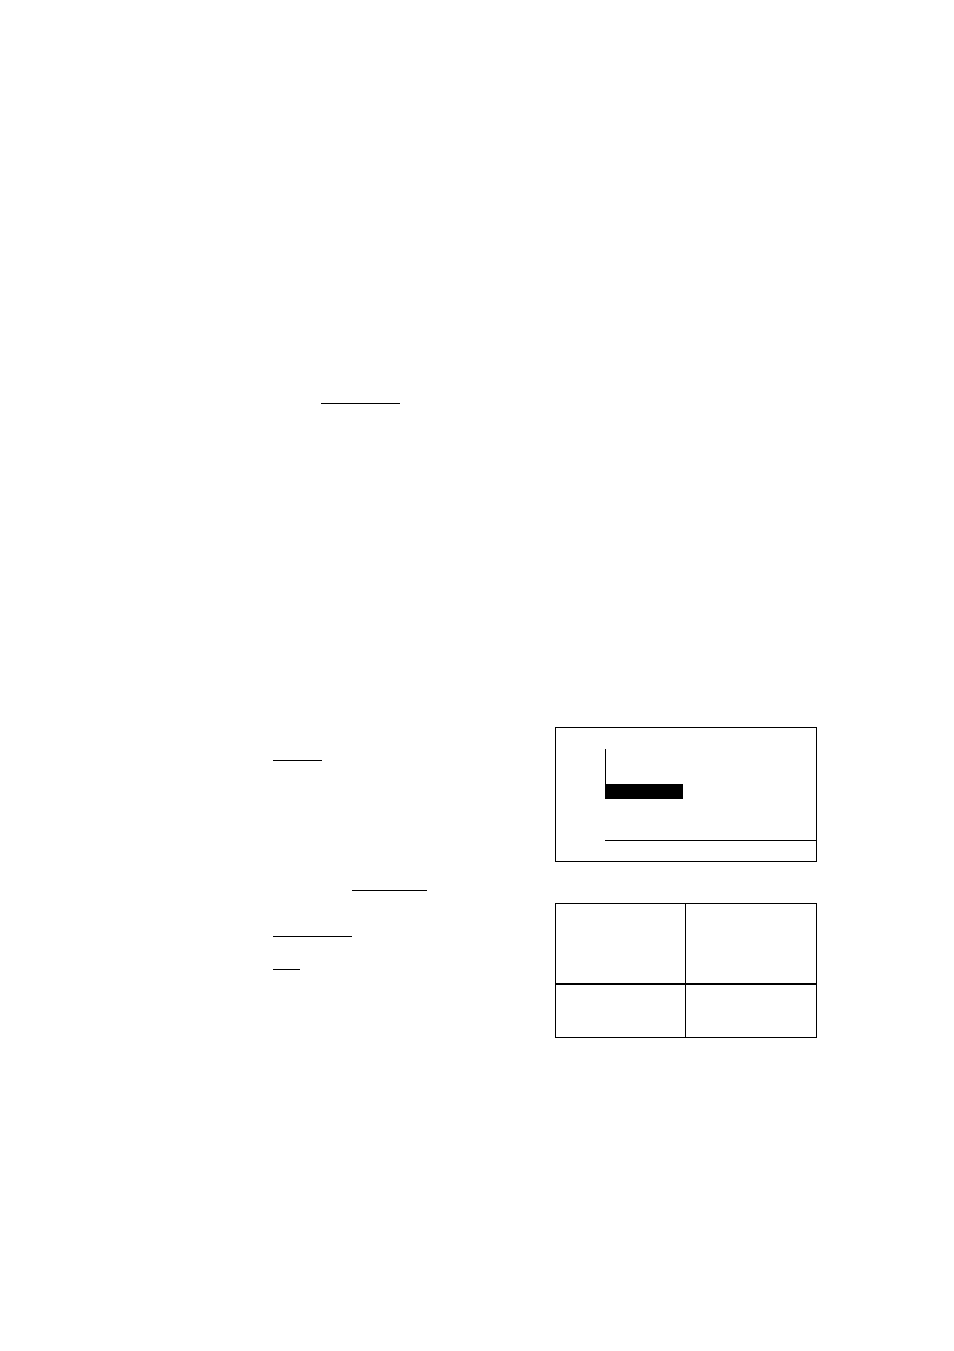
If, during plotting, a real value for the expression is not found,
Points
then that point is not plotted, and no line is connected
through it.
Tracing a Plot
When a graph is nev/ly drawn, TRACE mode is on. Pressing a
cursor key will trace the crosshairs along the graph, displaying
the coordinate values as they move.
Scrolling a Plot
In Function and Sequence aplets, you can scroll left and right
beyond the edge of the window to see more of the graph.
Zooming
Press
I PLOT [{{ZOOM}}
for a choice of zooming options. To
switch to a predefined axis scaling (such as Trig or Integer),
press ■
[VIEWS].
Examples: Plotting
Function
Plot the expression from the previous Function example,
Example
x' - 2x + 3 . In Plot Setup, specify YRNG ; - 3 . 1
5 so
that you can see more of the graph (the default values are
-3.1 and 3.2). You can leave the other plot settings at their
default values.
( O
b
I
Select
Function
{{START}}
Make sure the correct function
is highlighted and checked.
■ {SETUP-PLOT}
ryjfFlSfwriRl
1^*
FUNCTION
PLOT SETUPS*
HRNG:
-6.5
6.5
VfiNQ:
-3.1
5
«TICK:
1
VTICK: 1
fiES:
Faster
ENTER HDRiZDNTAL TICK iPACIMS
mm\
I PLOT I
{F}
6 times
(The cursor starts in the
center of the X -range and
traces the plot.)
, ,
j
J
/
« :
. 6
FlC«
i :
E.OIS liil:t!lll
3-8 Plotting and Exploring Fnnctions