HP 38g Graphing Calculator User Manual
Page 114
Attention! The text in this document has been recognized automatically. To view the original document, you can use the "Original mode".
I
LIB
I
Select
S t a t i s t i c s
{{START}}
■ [CLEAR] B ■ [CLEAR]
[Tl
to clear two data
columns, if necessary
Make sure that
{{IVAR
b
}}
is on for one-variable statistics. If it
isn't press
{{2VAR
b
}}.
n
Cl
C2
C3
C4
1
ItiiiiitiW«
4.25
I
ENTER
I
4.6
I
ENTER
I
4.7
fENTER
I
4.1
I
enter
!
B
to move to next column
250
I
ENTER
I
800
I
enter
I
900
Cl
H.as
H.C
H,?
H.l
C2
ESO
BOD
10»
C3
C4
11311 KfcjBB BHli B2Bi EBE03 B33S
I
ENTER
I
1000
r
ENTER
I
SYMB
{[C]]
1
I
ENTER
I
[[C]]
2
[ENTER]
ffliiTSTISTICS SVMEflUC MIEW^^
.-Hltci
C2
H2i—i
■ 1
H3!
1
H4!
i w
ENTER SAMPLE
This defines dataset HI v/ith sample data in Cl and
frequency data in C2. If HI is not already checked, press
{{VCHK}}.
[
nl
B {{
stats
}}
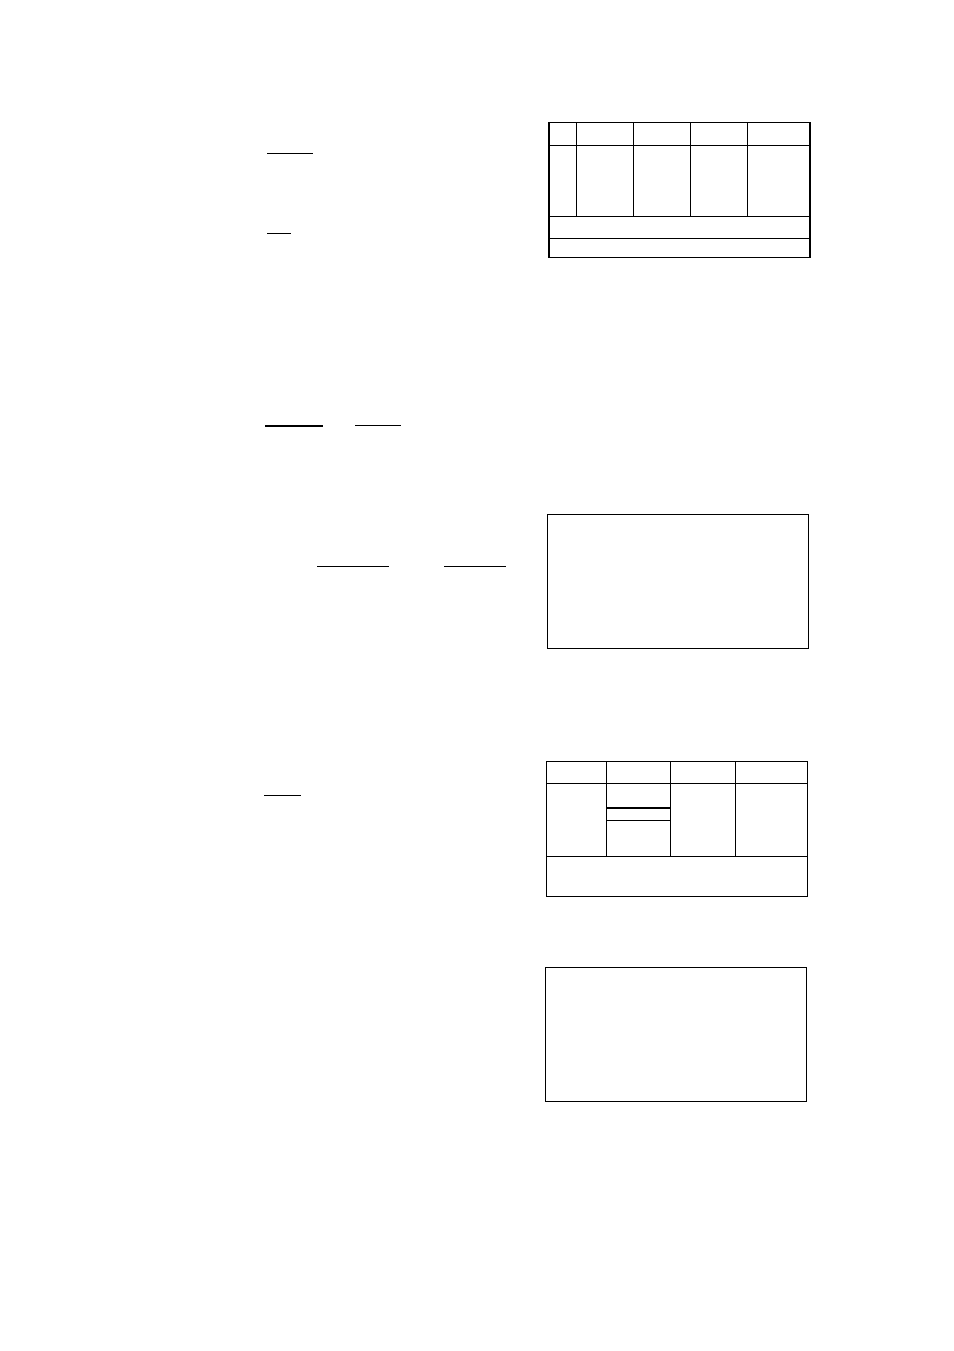
Displays computed statistics.
You can scroll down to see
other values, such as the
mean.
l-VAR
HI
HI.
TDTI
MEftNI
PVARZ
fVARZ
PSDEV
i30?a.s
faffreiv
.afiH07?R
The weighted mean price is $4.43 per part.
{{OK}}
■ [SETUP-PLOT]
Set these X, Y, and H ranges
and H WIDTH.
^EH^iTSTISTICS PLOT SETUPS*
ststpldt
: inBl
HWlOIH: . 1
KRNS: 4
5
VRNG: “100
1100
HRNG:
4
5
SELECT STATISTICS
PLOT TVPE
5-8 Statistics