Graph panel – Dell UPS 1000T User Manual
Page 69
Supervision
69
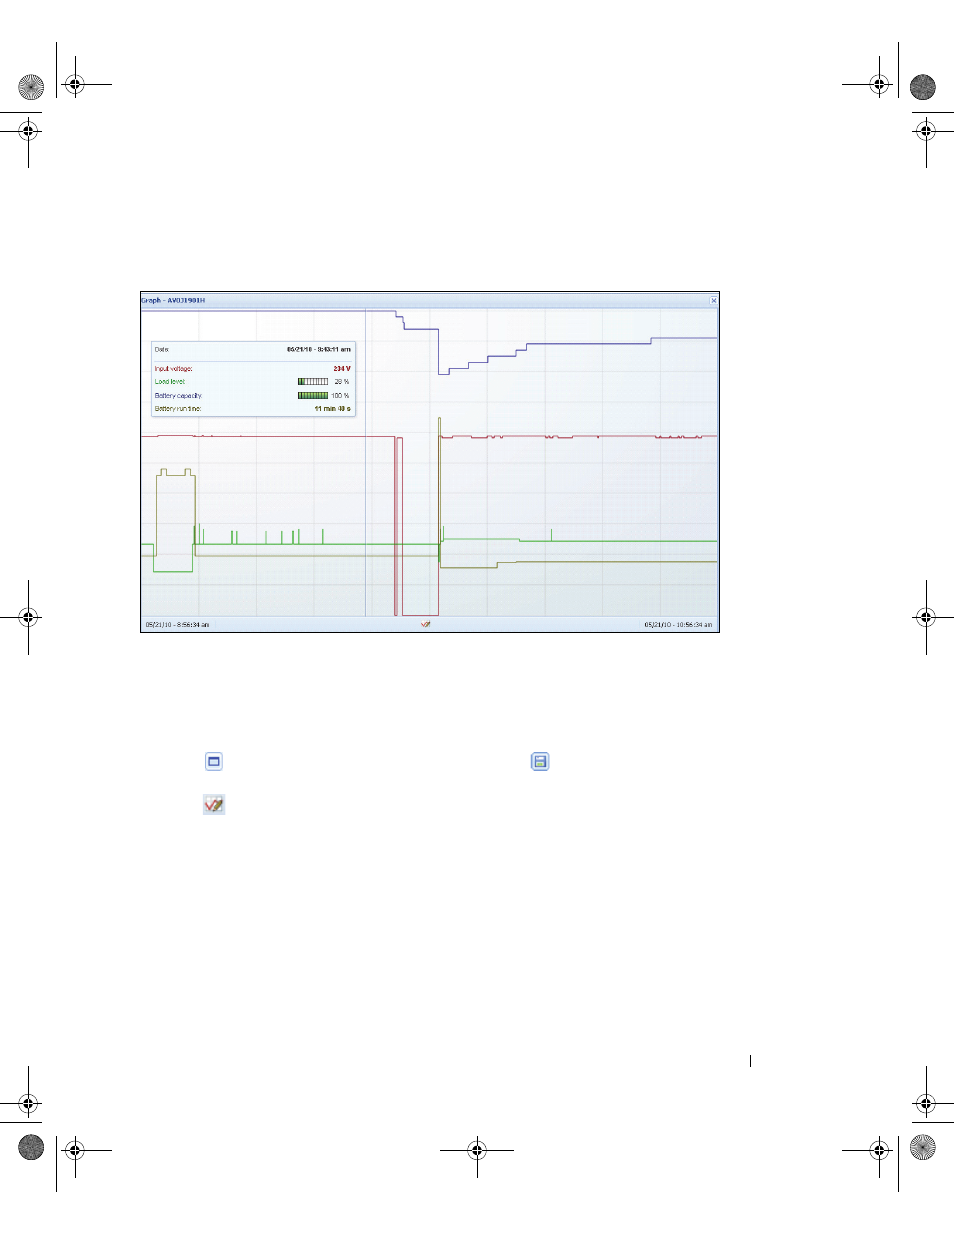
Graph Panel
This panel displays the graph of the main measures of the selected device (see Figure 53).
Figure 53. Graph Panel
NOTE:
In this window, you can select up to eight measures simultaneously. Time scale possible values are 1 hour / 2
hours / 6 hours / 12 hours / 24 hours / 2 days / 1 week.
To read the values, place your mouse cursor over the graph. A vertical line appears over it and you can
read the values in the box for the selected date.
• The
button allows you to zoom in the graph and the
button allows you to export the data into
the graph.
• The
button allows you to select the data you want to display in the graph (see Figure 54).
0120_3-Dell ULNM UG.book Page 69 Saturday, November 2, 2013 5:34 PM