Rockwell Automation 1440-PK02-05M2 XM-720 Machine Monitor User Manual
Page 33
Publication GMSI10-UM001C-EN-E - June 2011
Installing the XM-720 Machine Monitor 33
To determine the signal amplitude on bargraph meter
To determine the signal amplitude in engineering units, use the following
formula:
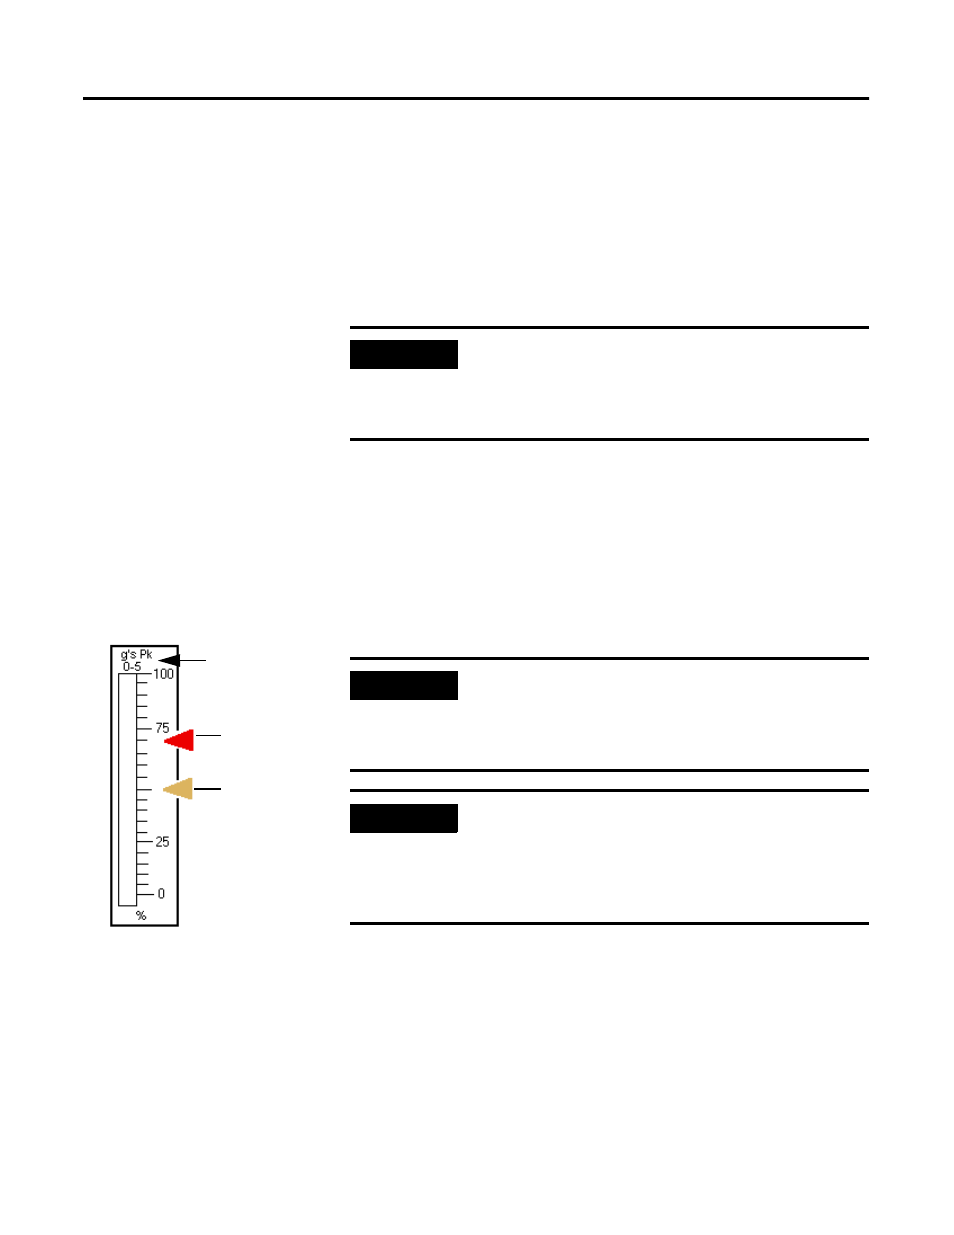
To determine placement for Alert and Danger Threshold Arrows
The caption sheet (included in package) contains red (danger) and orange
(alert) arrows for you to place on the meter to show the alert and danger
threshold levels. Use the following formula to determine placement of the
arrows.
Amplitude
Bargraph % 100
⁄
(
)
4-20mA Max Range value 4-20mA Min Range value
–
(
) 4-20mA Min Range value
+
×
=
EXAMPLE
meter reading: 40%
4-20mA Min Range value: 0 mils
4-20mA Max Range value: 5 mils
amplitude = (40% / 100) x (5 -0) + 0 = 2 mils
EXAMPLE
Alert Threshold value in configuration: 2.5 g
4-20mA Min Range value in configuration: 0 g
4-20mA Max Range value in configuration: 5 g
Alert threshold % sticker = (2.5 - 0) x 100% / (5 - 0) = 50%
EXAMPLE
Danger threshold value in configuration: 3.5 g
4-20mA Min Range value in configuration: 0 g
4-20mA Max Range value in configuration: 5 g
Danger threshold % sticker = (3.5 - 0) x 100% / (5 - 0) =
70%
Threshold %
Threshold value 4-20mA Min Range value
–
(
) 100%
×
4-20mA Max Range value 4-20mA Min Range value
–
(
)
----------------------------------------------------------------------------------------------------------------------------------------------
=
Place the orange
arrow sticker on meter
to show alert
threshold level (e.g.
50%).
Place the red arrow
sticker on meter to
show danger threshold
level (e.g. 70%).
Measure units/range
sticker