Care and use manual, Iv. column performance checks – Waters Amino Acid Analysis Liquid Chromatography Column User Manual
Page 6
[ Care and Use ManUal ]
6
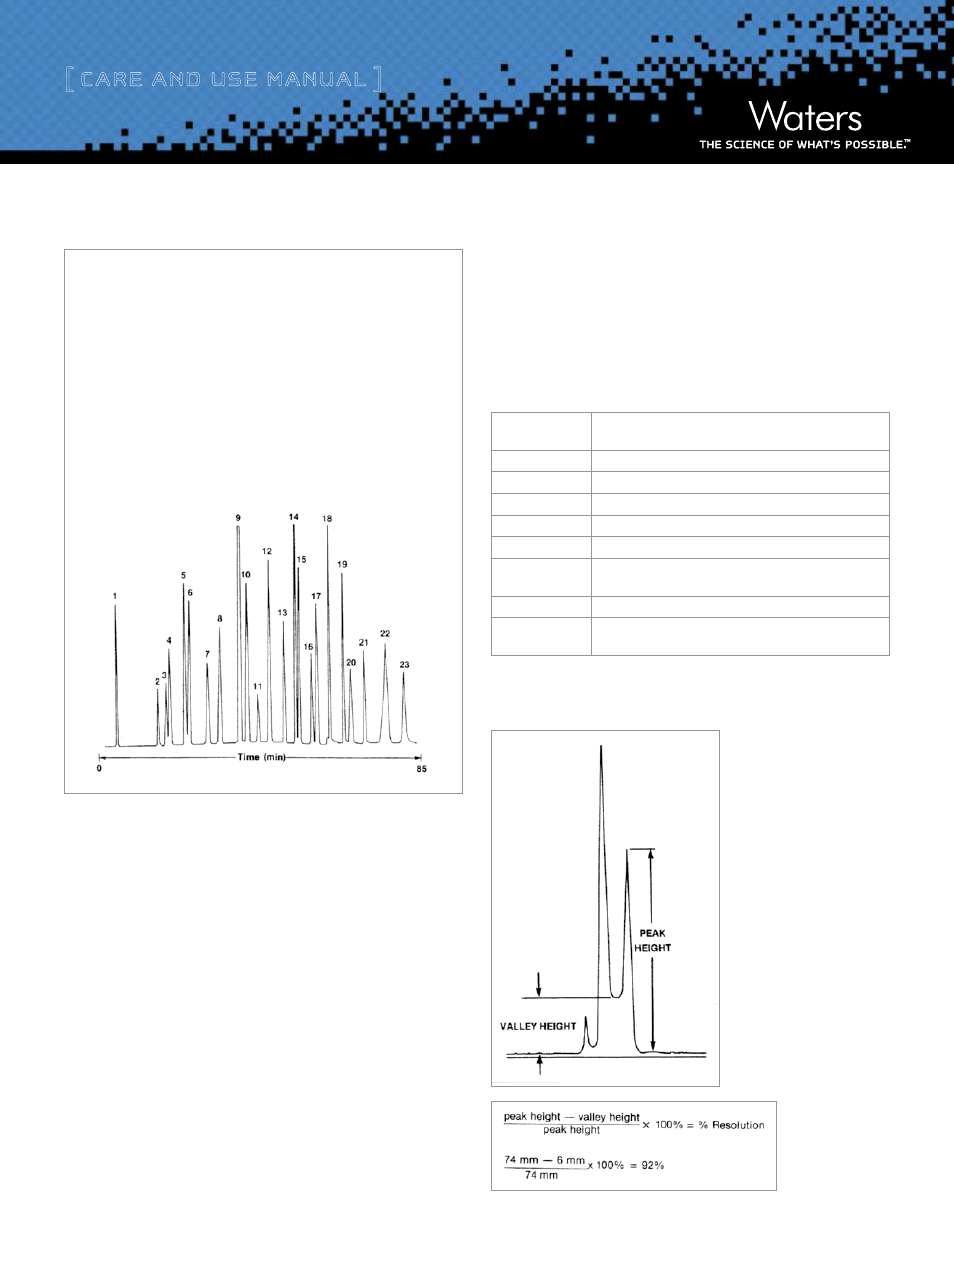
Figure 3: Amino Acid Analysis – Special Amino Acids
Variations in results as compared to the expected chromatogram can
usually be explained by improper buffer preparation (weighing/volume
error) or improper pH.
The following guidelines describe the effect of pH:
1. If Buffer A is 0.20 pH units too high, there will be a loss of THR-SER
resolution and OH-PRO will coelute with ASP.
2. If Buffer A is 0.30 pH units too low, there will be broadening of the
neutral amino acid peaks and ASP will elute later than expected.
3. If Buffer B is 0.20 pH units too high, ARG will coelute with NH. If
Buffer B is 0.20 units too low, ARG will elute 10-15 minutes later
than expected.
Increased column temperature will lead to a decrease in the elution
volume for all amino acids and a decrease in the THR-SER resolution.
IV. column Performance checks
Table 2 provides performance check information. Use the table
in conjunction with the following procedure to determine the
condition of your column. If you feel it has become contaminated, refer to
Troubleshooting section for appropriate column cleaning procedures.
Table 2: Performance Check for Columns
Column:
Waters Amino Acid Analysis Column
(Part No. 80002)
Buffer:
A-ES1
Flow rate:
0.4 ml/min
Temperature:
62°C
Chart Speed:
0.25 cm/min
Detection:
Fluorescence (o-phthalaldehyde)
Sample:
Amino acid mixture contain¬ing equalmolar concentra¬tion
aspartic acid, threonine, serine, and glutamic acid
Sample Amount:
1-2 n mole of each amino acid in 5-20 µl volume
Results:
Chromatogram should show a minimum resolution of 85% for
all amino acids as determined by the following equation:
Figure 4: Resolution
1. Cysteic Acid
2. Methionine Sulfoxide
3. Hydroxy Proline
4. Aspartic Acid
5. Threonine
6. Serine
7. Glutamic Acid
8. Proline
9. Glycine
10. Alanine
11. Cystine
12. Valine
13. Methionine
14. Isoleucine
15. Leucine
16. Tyrosine
17. Phenylalanine
18. Histidine
19. Hydroxy Lysine
20. Tryptophan
21. Lysine
22. Ammonia
23. Arginine
Column:
CAT EX Resin Column
(0.4 cm x 25 cm)
Sample:
1 NMOL AA STDS
Injection Volume: 10 µL
Flow Rate:
0.4 mL/min
Mobile Phase:
A. 0.2 N Na citrate, pH 3.0
B. 0.2 N Na borate, pH 9.8
0
→100% B, curve 6, 48 min
Detector:
Model 420 ex: 338 nm
em: 425 nm
gain: 4