7 displaying results in microsoft excel, 8 various mrw software functions, Displaying results in microsoft excel – Eppendorf AF2200 Plate Reader User Manual
Page 44: Various mrw software functions
Operation
Eppendorf
®
PlateReader AF2200
English (EN)
44
6.4.7
Displaying results in Microsoft Excel
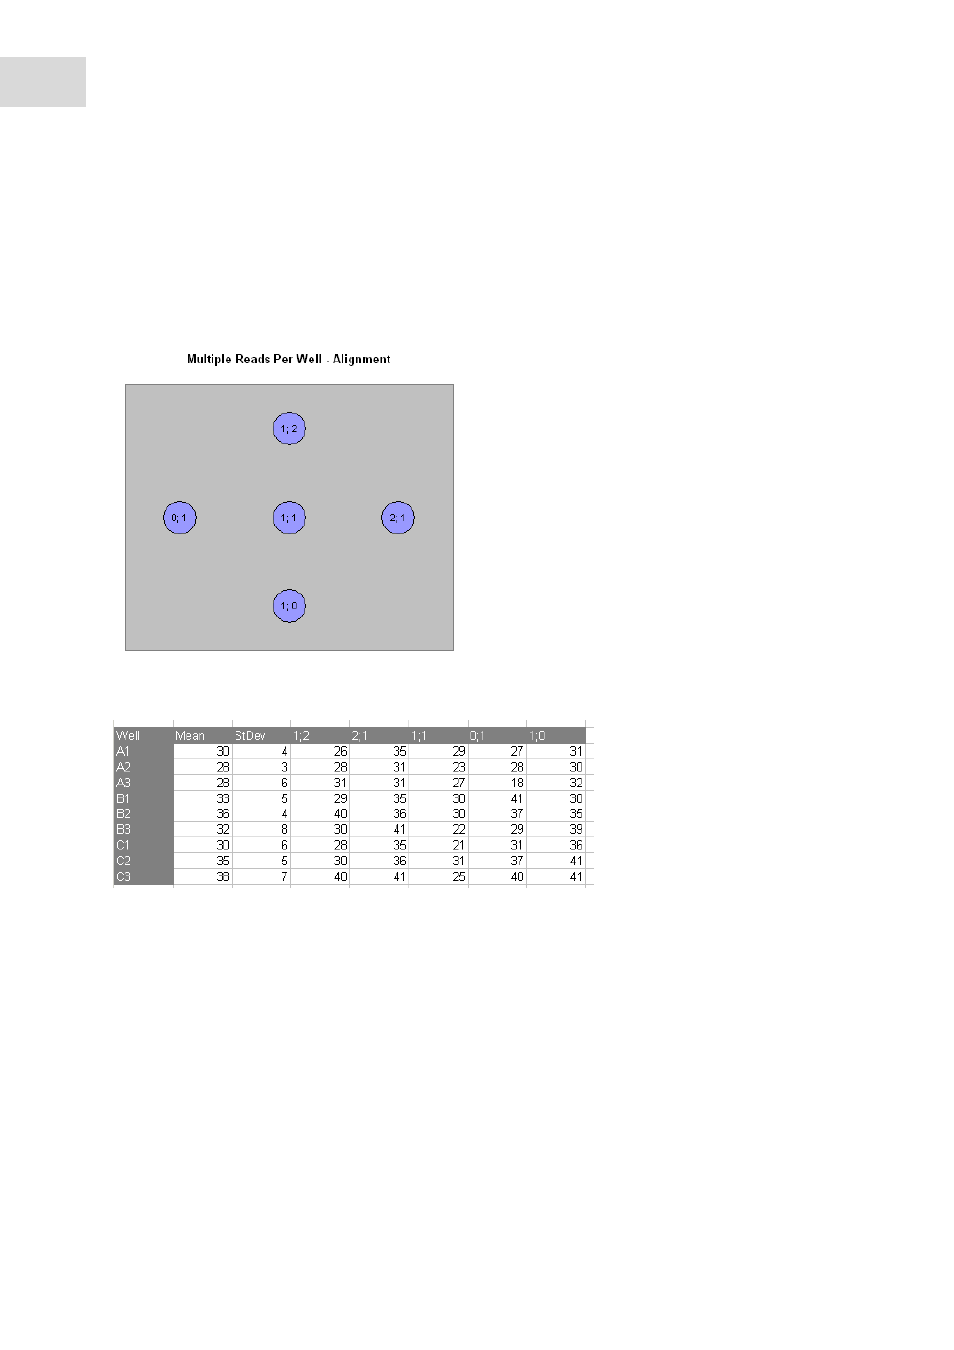
A graphic, schematic overview of the measuring points is displayed in the Microsoft Excel® results sheet
generated by the software. A number is assigned to each measuring point. The results are presented in a
list: the measuring point number compared to the result value. The standard deviation ("Stdev") and
average value ("Mean") of the measuring points/well are also displayed:
Abb. 6-8: Comparison graphic (XY line, 3 x 3)
Fig. 6-8:
Comparison graphic (XY line, 3 x 3)
Abb. 6-9: Example of an Excel results sheet
Fig. 6-9:
Example of an Excel results sheet
6.4.8
Various MRW software functions
The MRW function is not available during the measurement of individual wells.
"Reference wavelength" (on the absorbance strip) is not available in combination with "Multiple reads per
well“.