8 find function – Seiwa Starfish 2nd Edition User Manual
Page 34
36
User Manual
relative automatic info window and allows displaying a graphical page with the
tides prediction of the selected object. Press [E
XPAND
]:
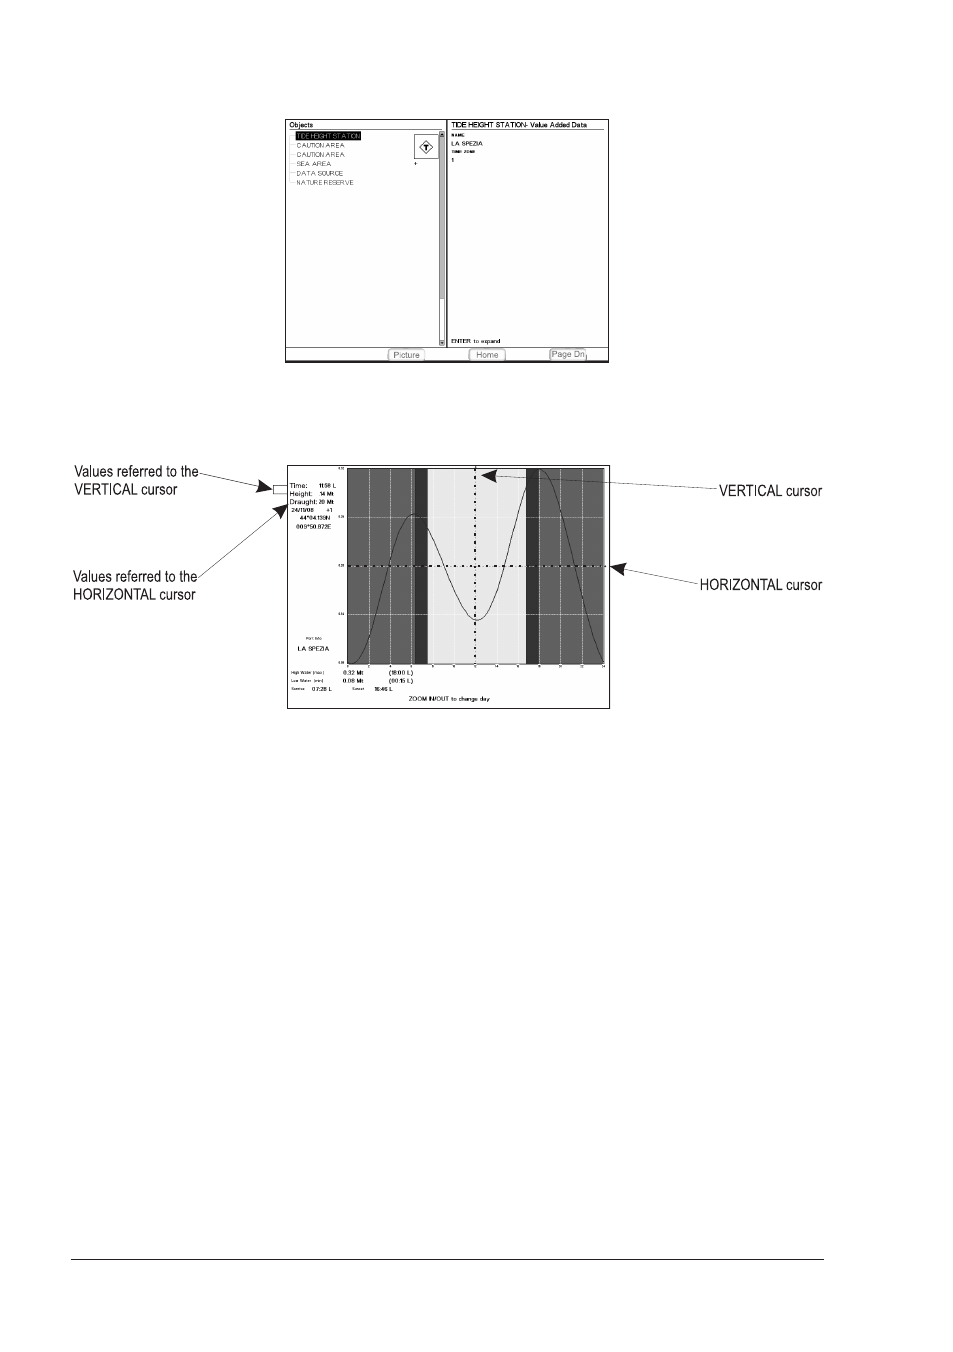
Fig. 2.7b - Tide information page
Press [ENTER] to display the Tide Graph page. It shows the Tide height variations
during the 24 hours at any given day.
Fig. 2.7c - Tide Graph page
This screen shows that day's Tide Height graph for the area where the Tidal
symbol was located. Using [ZOOM IN] and [ZOOM OUT] it is possible to display
future or past tides. If you wish to quickly display the tide for a specific date,
press [ENTER] and enter the required date.To simplify reading the graph, the
chart plotter displays a moveable Vertical and Horizontal slider which can be moved
using the cursor key. Using the up/down cursor key, move the horizontal slider to
correspond with the draft of your boat. Using the Vertical slider you can then read
the times at which the graph dips below the horizontal line i.e. the times when
you will be in danger of grounding.
NOTE
Tide graph is an approximation of the tide and they should be used in
conjunction with traditional tide tables and navigational methods. The Tide
height value represents the variation relative to the "Mean Lower Water"
value.
2.8
FIND FUNCTION
The Find function allows searching for the nearest Port, Port Services, Tide Sta-
tions, Wrecks, Obstructions, Points Of Interest and Lakes loaded on the DATA
MEDIA. When the Find function is activated a list of available objects to search is
shown. Also the Find function allows to center the screen over a selected User
Point, on the Cursor position or at desired Coordinates.