1 chart, 2 mib variable table, 1 chart 6.3.2 mib variable table – Allied Telesis AT-VIEW PLUS 3.0 DEVICE MANAGER User Manual
Page 74: Chart, Mib variable table
Allied Telesyn
AT-VIEW PLUS
DEVICE MANAGER
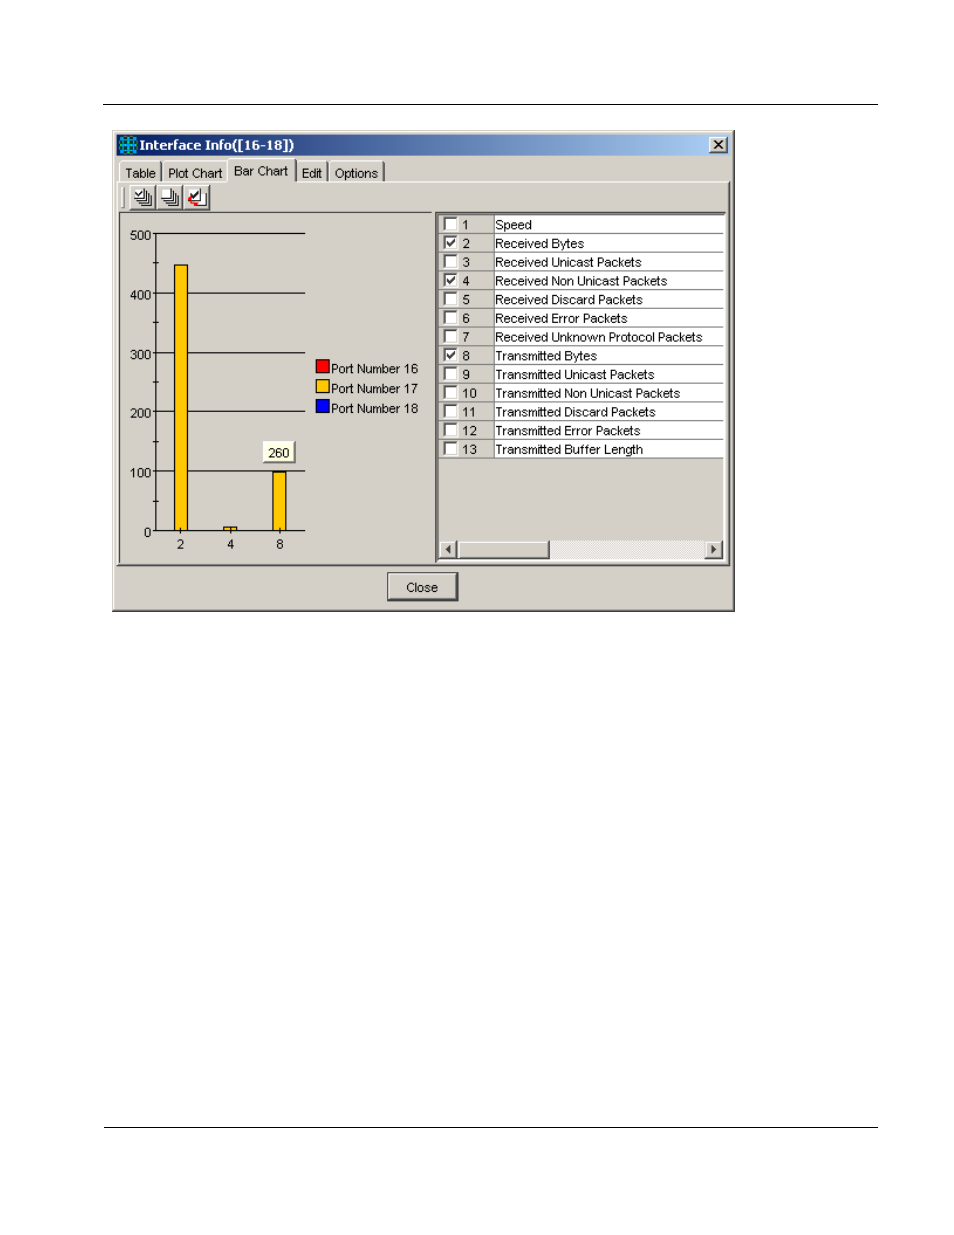
Bar Chart tab
The components of the Bar Chart tab are discussed below.
6.3.1 Chart
In the left half of the window is the chart showing the values of the selected variables. The vertical
(Y) axis shows the values and the horizontal (X) axis shows the variable name or number. You can
select whether to display the name or the number in Option > Option > Other.
Each variable is shown with a different color. The colors of the variables are displayed between the
chart and the variable table.
By placing the cursor on a bar, you can see the exact value of the variable.
6.3.2 MIB Variable Table
The right half of the window is the table of variables suitable for graph display. Each entry has a
checkbox. Only checked variables are shown on the chart.
Assume that you selected four variables to display. If one of the variables has a very large value, for
instance 1000000, and the other variables have much lower values, for instance around 100, the
vertical axis is automatically scaled to accomodate the largest variable. In this situation, you can see
PN 613-50664-00 Rev A
Page 74 of 127