1 graph, Graph, Mib variable table – Allied Telesis AT-VIEW PLUS 3.0 DEVICE MANAGER User Manual
Page 71
Allied Telesyn
AT-VIEW PLUS
DEVICE MANAGER
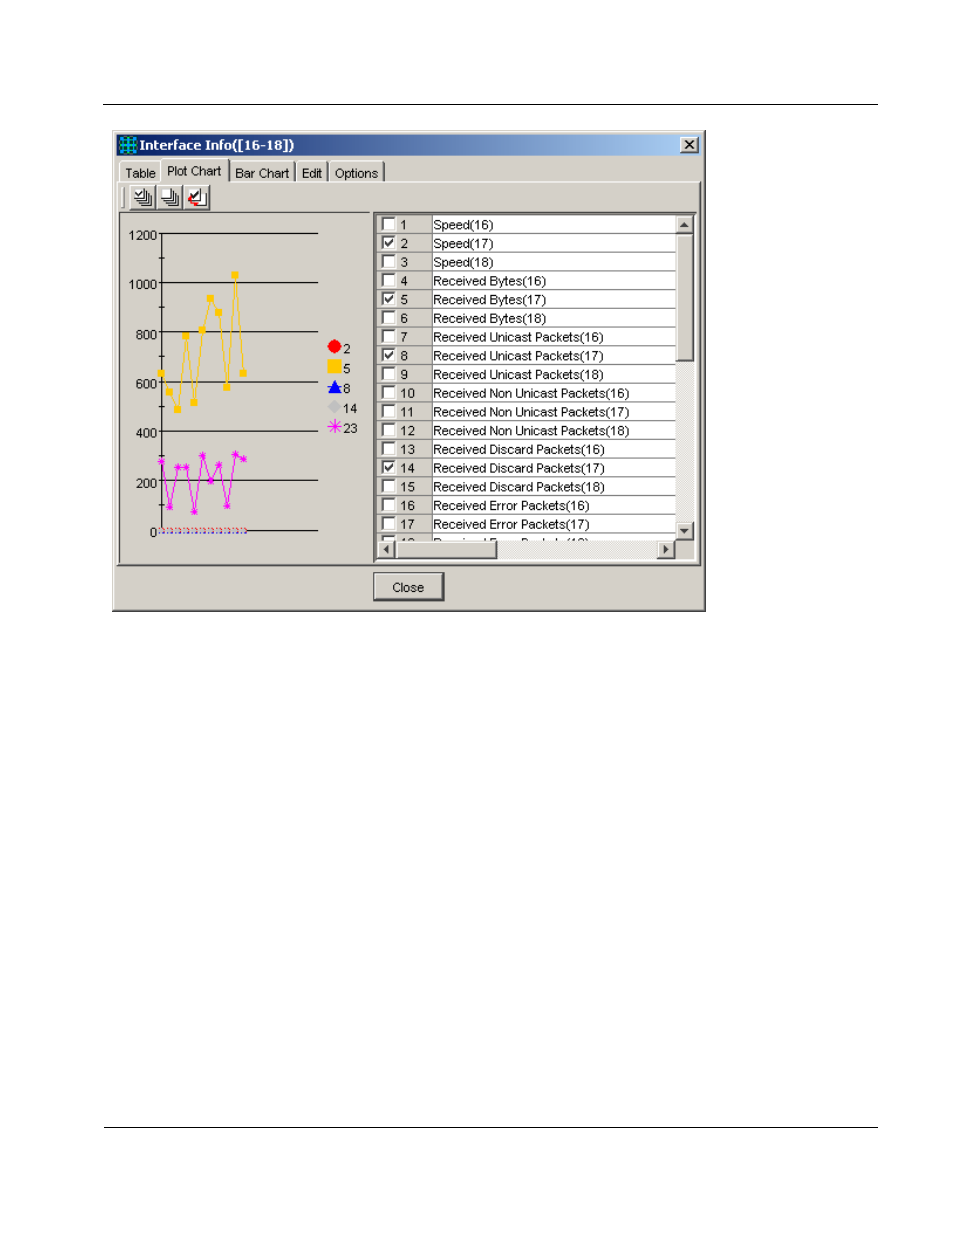
Plot Chart tab
The components of the Plot Chart tab are discussed below.
6.2.1 Graph
The left half of the window contains the graph showing the values of the selected variables. The
vertical (Y) axis shows the values and the horizontal (X) axis shows time. New values are plotted
when AT-View Plus Device Manager gets them, at the predefined polling interval.
The scale of the X-axis is automatically adjusted according to the number of values plotted. The X-
axis can display a maximum of the latest 20 values. The rightmost point is the most recent.
Each variable is plotted in a different color and shape. A list of the variables on the graph and their
shapes and colors is displayed between the graph and the variable table.
By placing the mouse cursor on the plotted dot on the graph, you can see the exact values
(coordinates) of the variable. For example, when you move the cursor onto the 10th point on the X-
axis which has a value of 100, the numbers "(10,100)" are displayed.
PN 613-50664-00 Rev A
Page 71 of 127