DAVIS Energy EnviroMonitor: Console User Manual
Page 25
Using the Energy EnviroMonitor
Page 18
Energy EnviroMonitor Manual
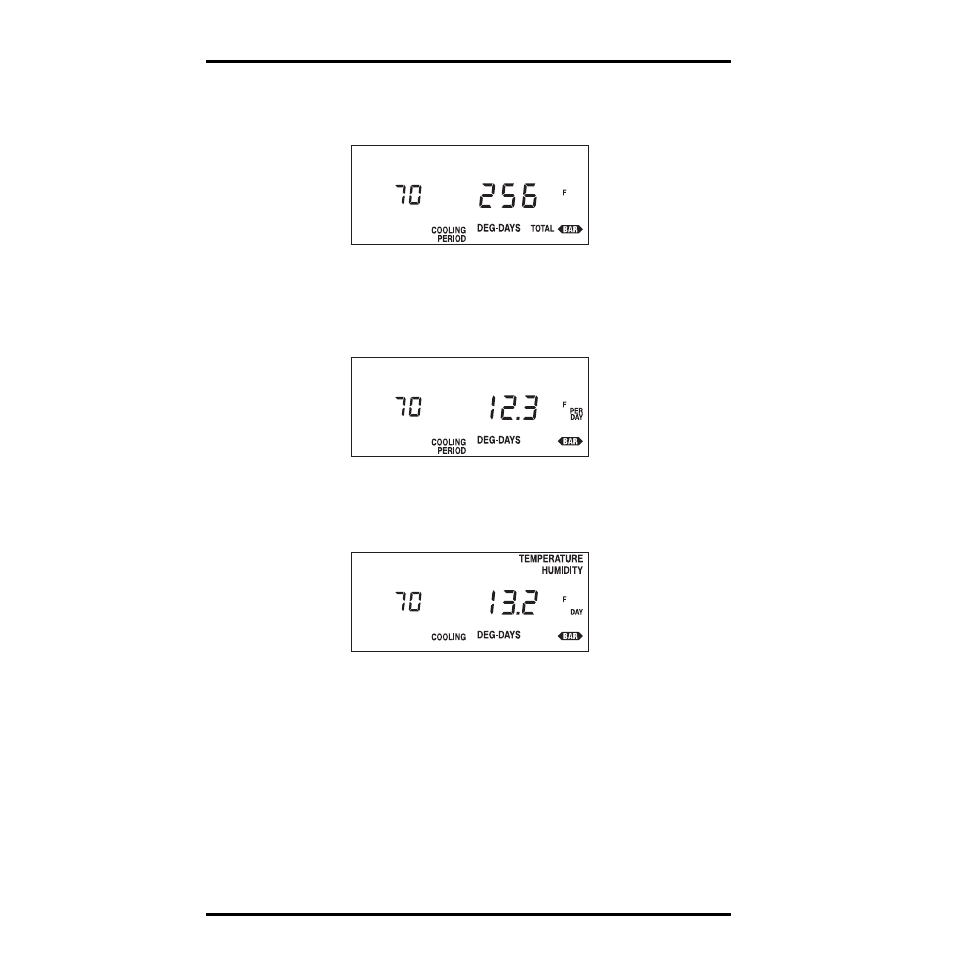
2. To display the total cooling degree-days for the period, press COOL’G D-DAYS again.
The total cooling degree-days for the period appear on the right of the dis-
play. The base threshold setting appears on the left of the display.
T
OTAL
C
OOLING
D
EGREE-
D
AYS
D
URING
P
ERIOD
3. To display the average daily cooling degree-days during the period, press
COOL’G D-DAYS again.
The average daily cooling degree-days appear on the right of the display.
The base threshold setting appears on the left of the display.
A
VERAGE
D
AILY
C
OOLING
D
EGREE-
D
AYS
D
URING
P
ERIOD
4. To display the daily T-H index cooling degree-days sum, press COOL’G D-DAYS again.
The daily T-H index cooling degree-days sum appears on the right of the
display. The base threshold setting appears on the left of the display.
D
AILY
T-H I
NDEX
C
OOLING
D
EGREE-
D
AYS
The daily T-H index cooling degree-days sum represents the total T-H index
cooling degree-days since the last time you (or AutoClear) cleared T-H index
cooling degree-days. For instructions on clearing daily T-H index cooling
degree-days, see “Clearing Daily Cooling Degree-Days Sum” on page 21.