HP Netserver L Server series User Manual
Page 125
Chapter 5
Monitoring
119
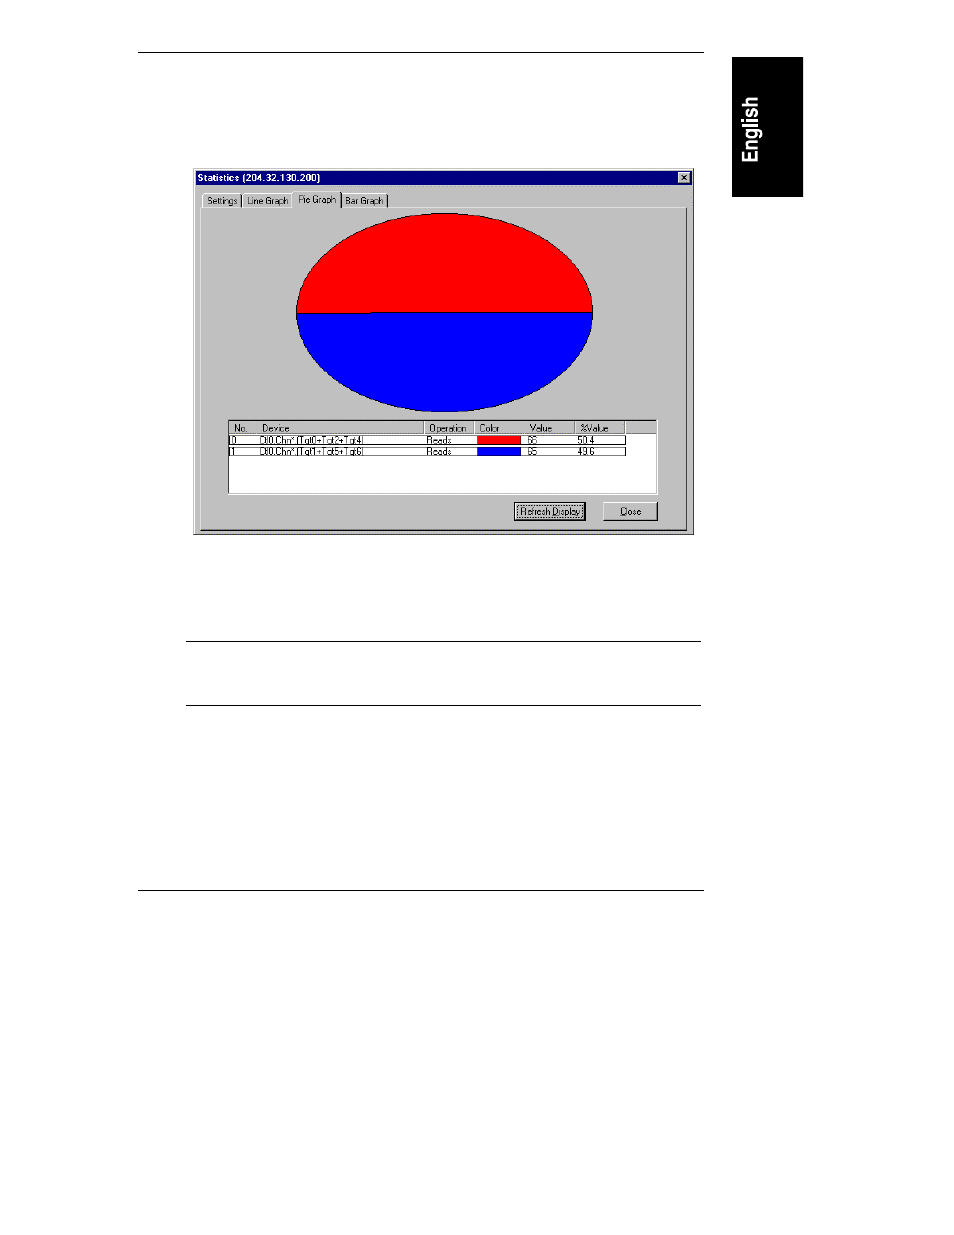
Pie Graph
Clicking the Pie Graph tab in Statistics View dialog box opens the Pie Graph data
page. See Figure 5-21.
Figure 5-21. Statistics View: Pie Graph Display
The Pie Graph page displays data for the analysis strings specified in the display
window in the form of a pie chart.
NOTE
The operation selected for your analysis strings should be the
same, due to the nature of a pie chart. If it is not, the data may
or may not be useful.
To update the data in the pie graph to the most current data, do the following:
•
Click Refresh Display.
To exit from the Pie Graph tab in the Statistics View, do one of the following:
•
Click Close to exit from Statistics View.
•
Or, click another Statistics View tab.
See also other documents in the category HP Computer hardware:
- xt1500 (58 pages)
- LaserJet 4700 (68 pages)
- ProLiant BL460c Gen8 Server Blade (67 pages)
- ProLiant DL360 Server (16 pages)
- ProLiant BL460c Gen8 Server Blade (65 pages)
- ProLiant DL388p Gen8 Server (128 pages)
- ProLiant BL40p Server series (73 pages)
- ProLiant BL465c Server Blade (87 pages)
- ProLiant DL388p Gen8 Server (47 pages)
- ProLiant ML115 Server (63 pages)
- ProLiant DL140 G2 Server (81 pages)
- Servidor HP ProLiant ML370 G4 (20 pages)
- Servidor HP ProLiant ML370 G4 (30 pages)
- Servidor HP ProLiant DL160 G5p (84 pages)
- Servidor HP ProLiant DL980 G7 (143 pages)
- Servidor HP ProLiant DL380 G5 (137 pages)
- Integrity Superdome sx1000 Server (53 pages)
- Integrity rx2620 Servers (37 pages)
- Integrity rx2620 Servers (58 pages)
- Integrity rx2620 Servers (77 pages)
- Integrity rx2620 Servers (107 pages)
- Integrity rx2620 Servers (55 pages)
- 9000 rp3440 Servers (36 pages)
- Integrity rx2620 Servers (42 pages)
- Integrity rx2620 Servers (48 pages)
- Integrity rx2620 Servers (53 pages)
- Integrity rx2620 Servers (24 pages)
- Integrity rx2620 Servers (33 pages)
- Integrity rx2620 Servers (100 pages)
- Integrity rx2620 Servers (37 pages)
- Servidor HP ProLiant DL360p Gen8 (129 pages)
- Servidor HP ProLiant DL120 G6 (133 pages)
- ProLiant DL580 Gen8 Server (91 pages)
- ProLiant MicroServer Gen8 (95 pages)
- ProLiant MicroServer (94 pages)
- ProLiant BL685c G5 Server Blade (99 pages)
- ProLiant Firmware Maintenance CD (87 pages)
- ProLiant BL10e Server Blade (232 pages)
- ProLiant BL40p Server series (30 pages)
- Serveur lame HP ProLiant BL680c G5 (90 pages)
- Serveur lame HP ProLiant BL465c Gen8 (578 pages)
- ProLiant DL320e Gen8 Server (96 pages)
- ProLiant ML110 G7 Server (113 pages)
- 9000 rp8420 Servers (38 pages)
- Integrity Superdome sx1000 Server (19 pages)