FUTEK VCal Sensor Verification User Manual
Page 25
Futek Advanced Sensor Technology – Futek VCal™Documentation
Rev. 1.8.0
07/26/05
©Futek Advanced Sensor Technology 2005
25
Plot -
This option allows you to create
3D Graphs
of your test results, or export your data to a spreadsheet application. Clicking the Plot
icon brings up the Plot interface. Here you can load your saved tests, determine which tests should be included in your plot, and then
either
Generate
your VCal™ 3D graph, or export your data to a spreadsheet application for further analysis or graphing.
Help -
This option allows you to access this
User Manual
.
Exit -
This option allows you to
Exit
the Reference Calibration interface of Futek VCal
TM
.
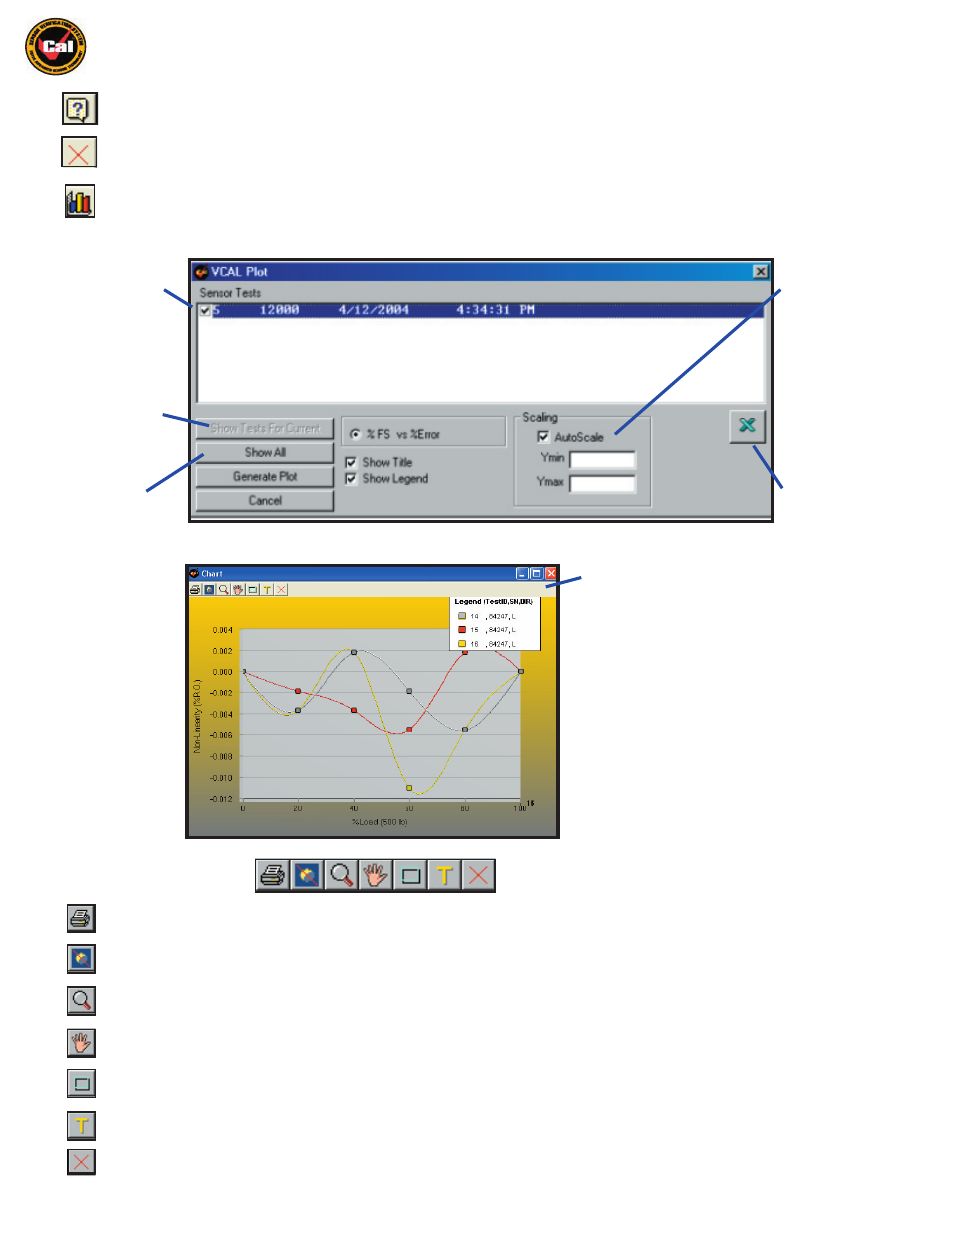
Select which test
results you would
like to create Graphs
of by selecting
check box
Show Tests for
Current - all saved
tests under current
ID
Show All - all
saved tests under
any ID
Autoscale Check
Box - Automati-
cally scales Y axis
based on given
values. Uncheck
to enter custom
values.
Select either Gen-
erate Plot (to
view Graph) or the
Export button to
send the data to a
spreadsheet
Clicking
Generate Plot
brings up this Plot screen . . .
Here, each colored line in the Graph represents a
separate set of test results chosen from the screen
above.
The bottom, or x-axis in this Graph represents %
of Load, while the vertical, or y-axis represents the
Non-Linearity error as a percentage of Rated
Output.
Plot Screen Toolbar
- This button allows you to print the current Graph(s) in the Plot screen.
Orbit
- Creates a 360 Degree orbit of the plot Graph(s) in a separate window.
Zoom
- Allows you to zoom in and out of the current Plot screen.
Pan
- Allows you to pan left to right or up and down withing the Plot screen.
Restore
- This button restores the default Graph view
Show Text
- This option creates markers indicating point values on the Graph(s).
Close
- Closes the Plot screen.