FEC AFC1200 User Manual
Page 40
)(& ,QF
7.4.6 Graph / Screen description
THe FASTENING CURVe screen diplays Torque information plotted along the vertical or "Y"
axis, and either Angle or Time information is plotted on the horizontal or "X" axis. An auxilliary
"accept" window is displayed in the plot area as a green box. The High and Low Torque
presets from the Set Parameter screen are used to automatically set the height of the window.
In "Angle Base", the window width will reflect the High and Low Angle presets in the same
manner. In "Time Base", the Torque parameters are displayed across the width of the plot
area. The System automatically configures each axis using the following formulas:
6-1. Torque - This vertical "Y" axis has a range based on the High Torque limit in Set
Parameter. This limit is multiplied by 1.2 and the result is set at the high limit of the
Axis scale. The range is multiplied by 1/8 to determine the incremental value of the
axis tick marks. This scale reflects "actual" torque values, and can be used as a
direct reference to interpret the (approximate) value of plotted torque points.
EXAMPLE:
HIGH TORQUE LIMIT = 50
(1.2) x (50) = 60 (The top end of the axis scale, with zero (0) at the low end.)
1/8 x 60 = 7.5 (Axis tick mark incremental value)
6-2. ANGLE - This horizontal "X" axis has a range based on the High Angle limit in Set
Parameter. This scale ends at the High Angle limIT, which displays at the far right on
the Fastening Curve screen. THE range and the low end of this axis scale is
determined by the ANGLE SCALE and DIVIDE (ANGLE) values as set on the
[SCALE] pulldown menu.
The ANGLE SCALE represents the number of samples (Torque/Angle readings) to
be plotted for each fastening. An Angle Scale setting of 200 will result in a Fastening
Curve with 200 points (Torque/Angle readings) plotted on the graph for each
fastening.
The DIVIDE(ANGLE) represents the sampling frequency in degrees of rotation
(angle). A DIVIDE(ANGLE) setting of "1" would result in a Fastening Curve with
Torque/Angle readings plotted on the graph after every one (1) degree of rotation.
The ANGLE SCALE (number of samples plotted) multiplied by the DIVIDE(ANGLE)
(degrees of rotation between samples) is equal to the range shown on the Angle axis.
This range is applied to the front of the high Angle limit, so the axis scale always ends
at the preset High Angle limit. The scale may begin at a negative (-) number. The
axis scale does not reflect "actual" angle values (degrees) and cannot be used as a
direct reference to interpret the value of plotted points. To determine the actual Final
Angle, the value of the final point must be computed from the zero (0) point.
The fastening curve ends with the Final Angle/Peak Torque reading, as numerically
displayed in the upper left portion of the graph. If a Fastening Curve is displayed for
multiple spindles, the numerical display will correlate to only one of the spindles as
described in Section 7.4.2.
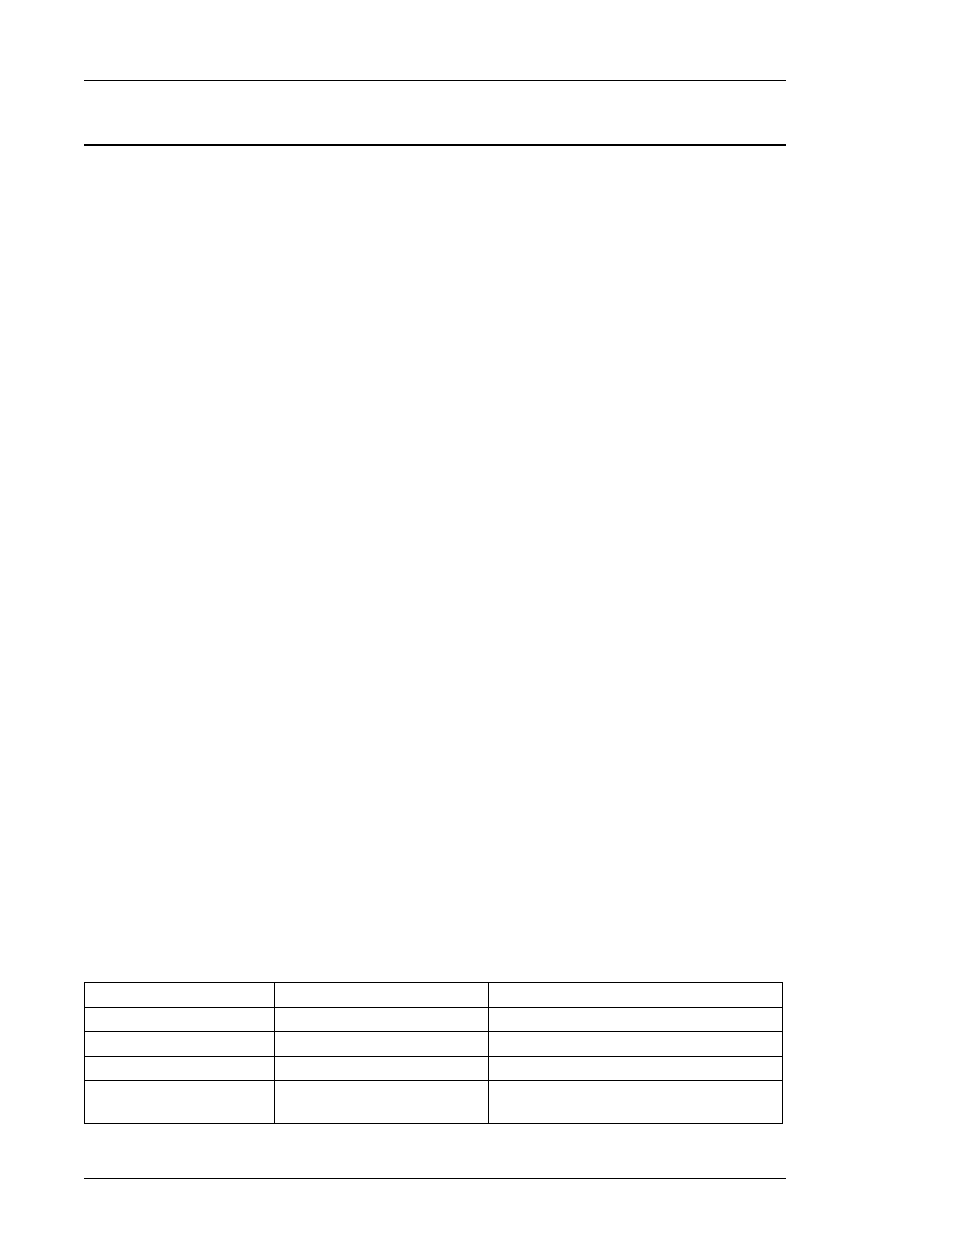
Refer to Figure 7-4-4 for an illustration of the following:
200 points (Torque/Angle readings) will
be plotted for each Fastening Curve.
200
Angle Scale
(Used in Yield Control, only)
(N/A for this example)
Elongation Angle
(Plotted as part of fastening curve.)
(Fastening Result: 13.7))
Final Angle
(Plotted as part of fastening curve.)
(Fastening Result: 33.16)
Peak Torque
SETTING RESULTS
SETTING
SCREEN DISPLAY
Chapter 7: System Operation
Page 7-40